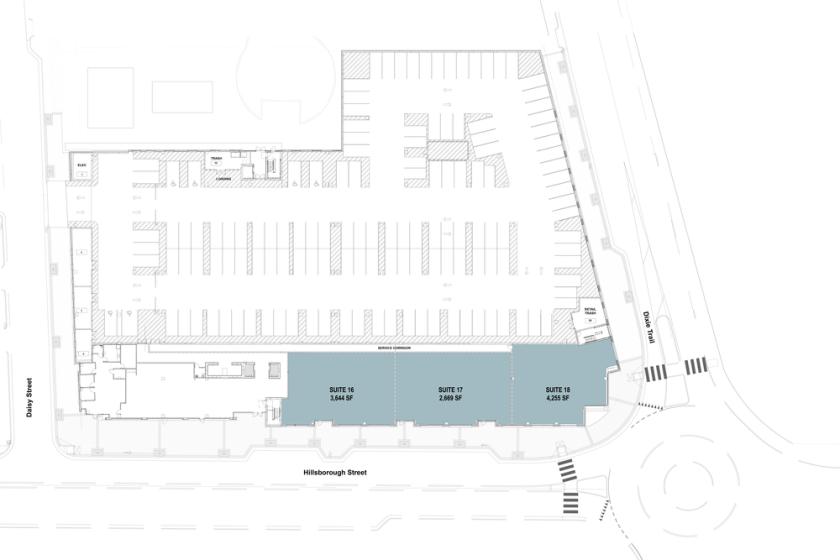
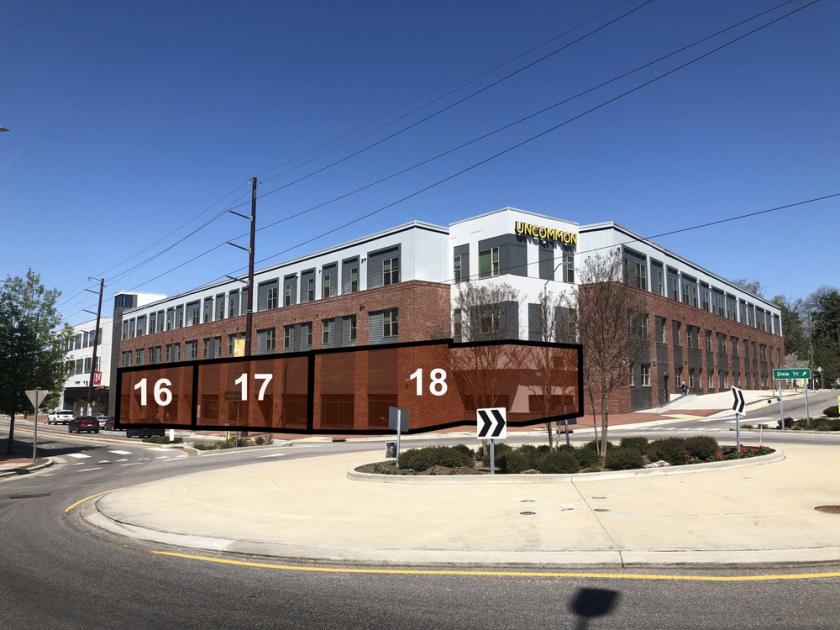
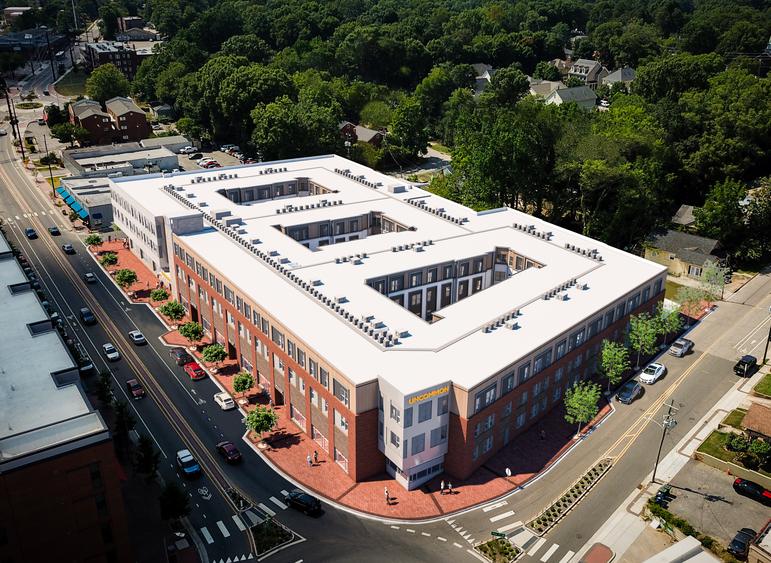
1-Mile | 3-Miles | 5-Miles | ||
---|---|---|---|---|
Total Population | 19,800 | 97,927 | 217,035 | |
Population Median Age | 26 | 33 | 35 | |
Population by Age | 0-9 Yrs | 832 (4%) | 8603 (8%) | 23297 (10%) |
10-19 Yrs | 7638 (38%) | 15103 (15%) | 28255 (13%) | |
20-29 Yrs | 6750 (34%) | 28590 (29%) | 52385 (24%) | |
30-39 Yrs | 1580 (7%) | 14573 (14%) | 34981 (16%) | |
40-49 Yrs | 863 (4%) | 9285 (9%) | 23911 (11%) | |
50-59 Yrs | 940 (4%) | 8964 (9%) | 21703 (9%) | |
60-69 Yrs | 724 (3%) | 7393 (7%) | 18069 (8%) | |
70+ Yrs | 473 (2%) | 5415 (5%) | 14434 (6%) | |
Median HH Income | $55,130 | $64,423 | $62,913 | |
Total Household Income | < 24K | 1131 (27%) | 7338 (19%) | 15307 (18%) |
25-49K | 689 (16%) | 7488 (20%) | 19201 (22%) | |
50-74K | 711 (17%) | 5864 (15%) | 14203 (16%) | |
75-99K | 348 (8%) | 4136 (11%) | 10410 (12%) | |
100-199K | 760 (18%) | 7822 (21%) | 17680 (20%) | |
200K+ | 416 (10%) | 4504 (12%) | 7907 (9%) | |
Highest Education Level | No Diploma | 412 | 3907 | 13151 |
Diploma or GED | 505 | 6628 | 20732 | |
Some College | 862 | 8144 | 21484 | |
Assoc. Degree | 220 | 3110 | 8582 | |
Bachelors Degree | 2690 | 21685 | 45565 | |
Higher Degree | 1697 | 15068 | 28941 | |
Total Housing Units | 4,671 | 41,300 | 94,766 | |
--Owner-Occupied | 1,337 | 14,889 | 37,029 | |
--Renter-Occupied | 2,718 | 22,263 | 47,680 | |
Owner-Occupied Values | < 100K | 40 | 385 | 2159 |
100-199K | 78 | 2147 | 7948 | |
200-299K | 115 | 2721 | 7835 | |
300-399K | 171 | 2548 | 7044 | |
400-499K | 193 | 1874 | 3922 | |
500K+ | 741 | 5215 | 8119 | |
Total Working Age Population | 18,640 | 85,794 | 182,180 | |
In Work Force | 6,935 | 54,570 | 121,483 | |
Not In Work Force | 11,704 | 31,223 | 60,697 | |
Workforce Employed | 6,569 | 52,795 | 116,413 | |
Workforce Unemployed | 357 | 1,689 | 4,861 | |
Civlian Workforce | 6,926 | 54,483 | 121,274 | |
Military Workforce | 9 | 87 | 209 | |
Total Households | 4,055 | 37,152 | 84,709 | |
Family Households | 1,638 | 15,853 | 41,667 | |
Non-Family Households | 2,417 | 21,299 | 43,042 | |
Married Couple | 1,226 | 12,194 | 29,710 | |
Other Family | 413 | 3,659 | 11,957 | |
Married w/Child | 467 | 5,221 | 12,666 | |
Single Male w/Child | 59 | 425 | 1,493 | |
Single Female w/Child | 135 | 1,619 | 5,274 |
Population Change Last Two Decades - Plus Projection
2000 | % | 2010 | % | 2020 | % | 2030 | |
---|---|---|---|---|---|---|---|
North Carolina | 8,049,313 | +18 | 9,535,483 | +11 | 10,630,691 | +11 | 11,836,070 |
Johnston County | 121,965 | +38 | 168,878 | +26 | 212,401 | +27 | 269,736 |
Wake County | 627,846 | +44 | 900,993 | +23 | 1,109,883 | +20 | 1,328,336 |
Total Working Age Population:
Total Households:
Total Working Age Population:
Total Households:
Total Working Age Population:
Total Households: