Retail Space
12536 Capital Boulevard Wake Forest, NC 27587
12536 Capital Boulevard Wake Forest, NC 27587
Details & Description
Property Highlights
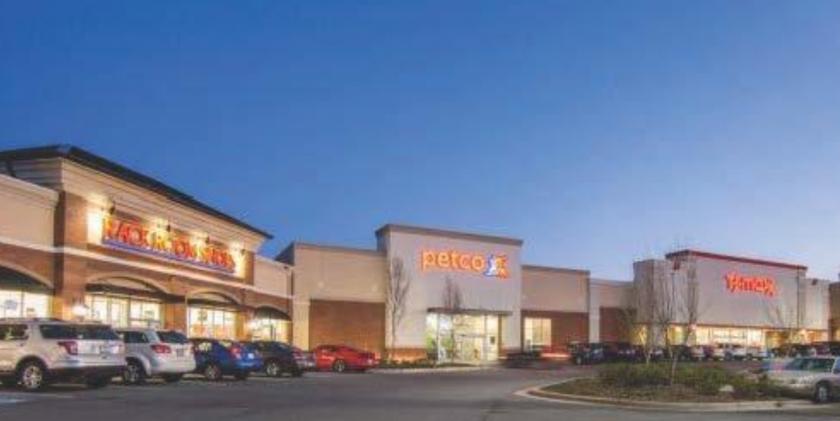
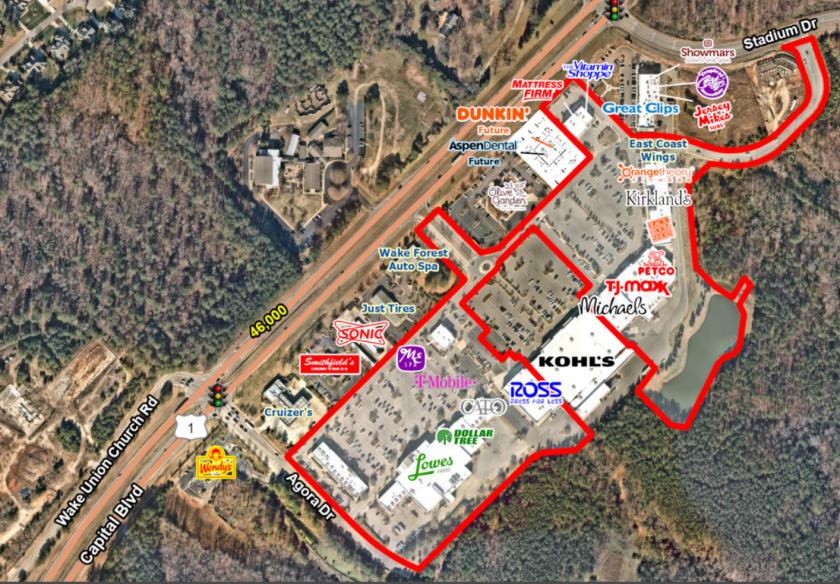
• Premier center in Wake Forest that is anchored by Lowes Foods, TJ Maxx, Kirklands, Ross Dress for Less and more
• Available 1,200 SF 1,200 SF 1,600 SF 2,400 SF 4,055 SF
Listing Agents

Jeff Nimmer
O: 919-380-8041
jeff.nimmer@tscg.com
O: 919-380-8041
jeff.nimmer@tscg.com
While we strive to provide the most accurate information, all listing information, and demographic data, is provided by third-parties. As such, MyEListing will not be responsible for the accuracy of the information. It is strongly recommended that you verify all information with the listing agent, and any relevant agencies, prior to making any decisions.