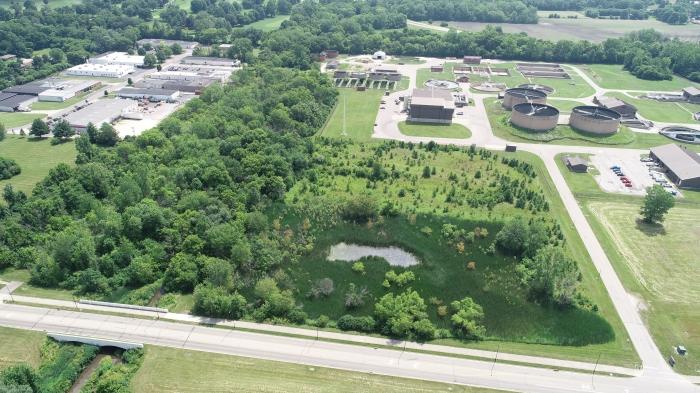
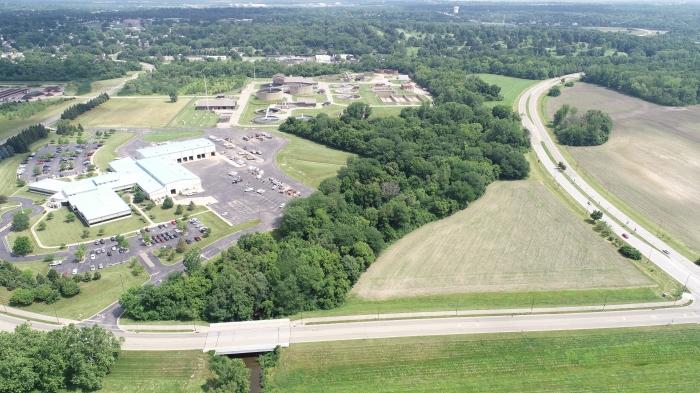
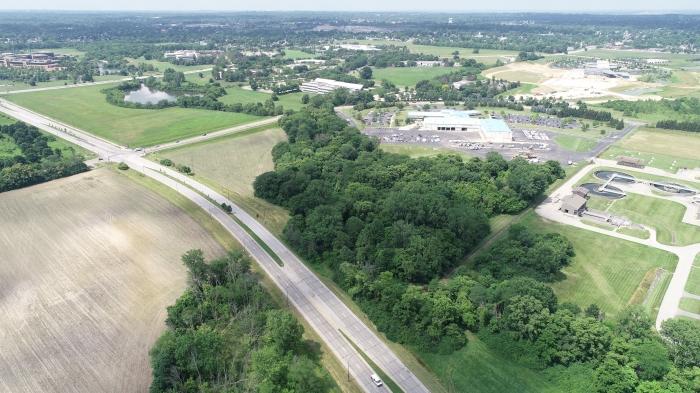
1-Mile | 3-Miles | 5-Miles | ||
---|---|---|---|---|
Total Population | 4,359 | 83,744 | 203,991 | |
Population Median Age | 40 | 39 | 38 | |
Population by Age | 0-9 Yrs | 569 (13%) | 10417 (12%) | 23778 (11%) |
10-19 Yrs | 470 (10%) | 9418 (11%) | 27397 (13%) | |
20-29 Yrs | 558 (12%) | 11771 (14%) | 34906 (17%) | |
30-39 Yrs | 540 (12%) | 12028 (14%) | 26613 (13%) | |
40-49 Yrs | 537 (12%) | 9427 (11%) | 22070 (10%) | |
50-59 Yrs | 699 (16%) | 12073 (14%) | 26631 (13%) | |
60-69 Yrs | 496 (11%) | 10060 (12%) | 22192 (10%) | |
70+ Yrs | 489 (11%) | 8550 (10%) | 20405 (10%) | |
Median HH Income | $59,048 | $55,456 | $57,714 | |
Total Household Income | < 24K | 279 (14%) | 7734 (20%) | 18047 (21%) |
25-49K | 470 (24%) | 9095 (24%) | 18829 (22%) | |
50-74K | 398 (20%) | 7102 (19%) | 14946 (17%) | |
75-99K | 404 (21%) | 5748 (15%) | 11509 (13%) | |
100-199K | 330 (17%) | 6191 (16%) | 16176 (19%) | |
200K+ | 17 (0%) | 969 (2%) | 4019 (4%) | |
Highest Education Level | No Diploma | 311 | 4550 | 11159 |
Diploma or GED | 860 | 15632 | 30763 | |
Some College | 824 | 15833 | 31690 | |
Assoc. Degree | 412 | 6528 | 13001 | |
Bachelors Degree | 486 | 10117 | 26023 | |
Higher Degree | 255 | 6768 | 21598 | |
Total Housing Units | 2,026 | 40,159 | 92,263 | |
--Owner-Occupied | 1,416 | 23,204 | 49,640 | |
--Renter-Occupied | 481 | 13,635 | 33,886 | |
Owner-Occupied Values | < 100K | 812 | 11036 | 16909 |
100-199K | 446 | 9355 | 20728 | |
200-299K | 102 | 2072 | 7478 | |
300-399K | 49 | 535 | 2552 | |
400-499K | 0 | 80 | 965 | |
500K+ | 8 | 126 | 1010 | |
Total Working Age Population | 3,497 | 67,198 | 165,664 | |
In Work Force | 2,288 | 43,132 | 103,755 | |
Not In Work Force | 1,209 | 24,066 | 61,910 | |
Workforce Employed | 2,219 | 40,577 | 96,920 | |
Workforce Unemployed | 45 | 1,749 | 5,021 | |
Civlian Workforce | 2,264 | 42,326 | 101,942 | |
Military Workforce | 24 | 806 | 1,813 | |
Total Households | 1,897 | 36,839 | 83,527 | |
Family Households | 1,100 | 21,242 | 48,927 | |
Non-Family Households | 797 | 15,597 | 34,600 | |
Married Couple | 827 | 15,265 | 35,544 | |
Other Family | 273 | 5,977 | 13,383 | |
Married w/Child | 346 | 5,769 | 13,616 | |
Single Male w/Child | 12 | 1,061 | 2,327 | |
Single Female w/Child | 72 | 2,018 | 4,841 |
Population Change Last Two Decades - Plus Projection
2000 | % | 2010 | % | 2020 | % | 2030 | |
---|---|---|---|---|---|---|---|
Ohio | 11,353,140 | +2 | 11,536,504 | 0 | 11,574,870 | 0 | 11,615,100 |
Clark County | 144,742 | -4 | 138,333 | -4 | 133,240 | -3 | 129,900 |
Greene County | 147,886 | +9 | 161,573 | +2 | 164,940 | +1 | 165,780 |
Montgomery County | 559,062 | -4 | 535,153 | -4 | 513,830 | -3 | 496,650 |
Total Working Age Population:
Total Households:
Total Working Age Population:
Total Households:
Total Working Age Population:
Total Households: