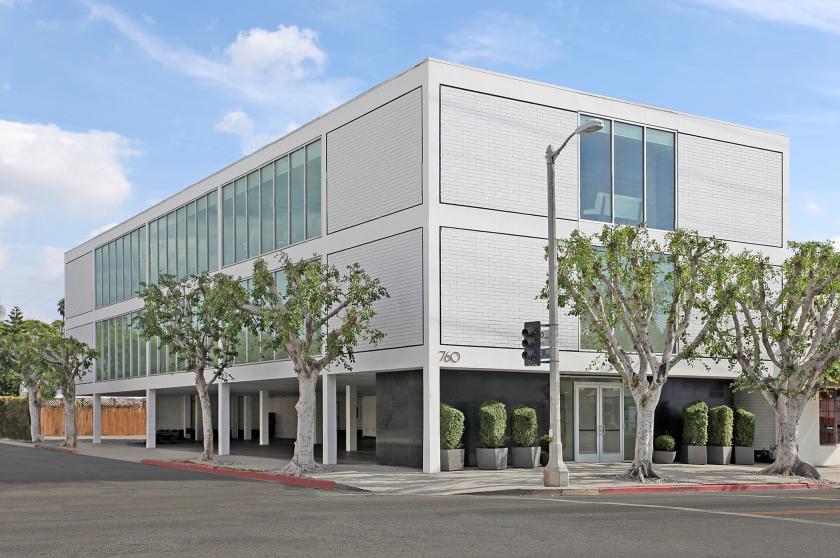
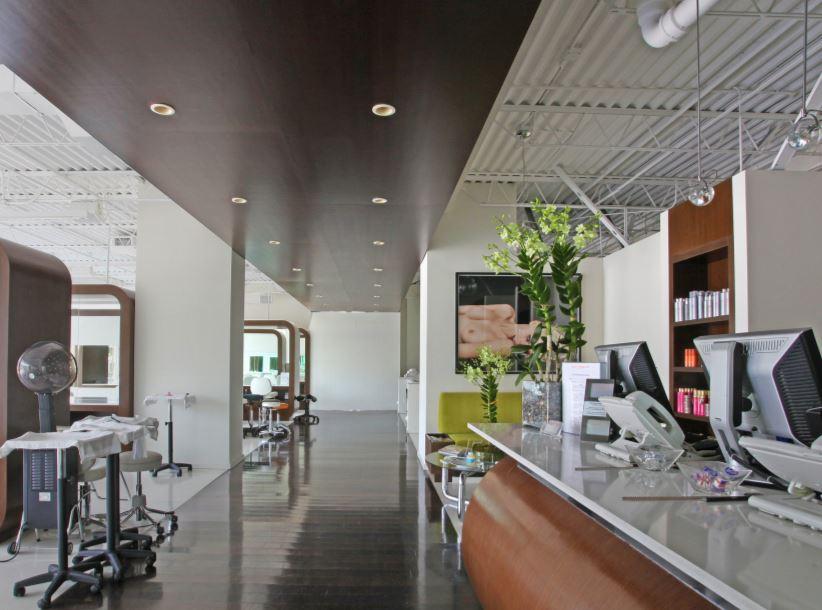
760 North La Cienega Boulevard is a 12,060 square foot office building comprised of two approximately 6,000 square foot floors over at-grade parking for twenty-two cars. The property is situated on 6,425 square feet of C4-zoned land on the southeast corner of La Cienega Boulevard and Waring Avenue.The Subject Property is located in the La Cienega Design Quarter and is adjacent to both West Hollywood and Beverly Hills, two of the most sought-after and valuable real estate markets in the country. This is a strong submarket for office, retail and showroom properties and is renown for being home to numerous interior design, fashion and home furnishing firms as well as some of the very best restaurants and shopping in all of Los Angeles.This landmark building was designed by celebrated California Modernist Craig Ellwood in 1961 and represents one of the finest Mid-Century Modern commercial buildings in Los Angeles. It was fully renovated in 2008, including new windows, façade and entryways, elevator modernization, HVAC, security system upgrades and a redesigned lobby and bathrooms.The beautifully appointed interior features high-ceiling, creative space with north facing floor-to-ceiling glass that boasts stunning views of the Hollywood Hills. This rare combination of location and build out is coveted by credit users and has attracted the current tenants, a high-end design firm and an industry-leading salon. Galleries, design studios and creative office users in entertainment, fashion and architecture are natural fits for this airy, functional space. The layout is open enough to provide a blank canvas to design and decorate the premises to fit any tenant’s needs and aesthetic preferences.