Specialty Real Estate
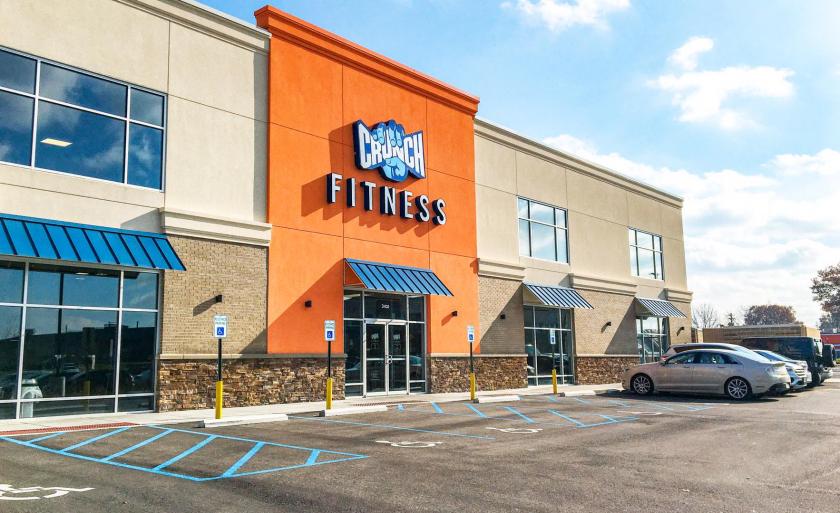
3401 Ibsen Avenue Cincinnati, OH 45209
3401 Ibsen Avenue Cincinnati, OH 45209

Details & Description
Property Highlights
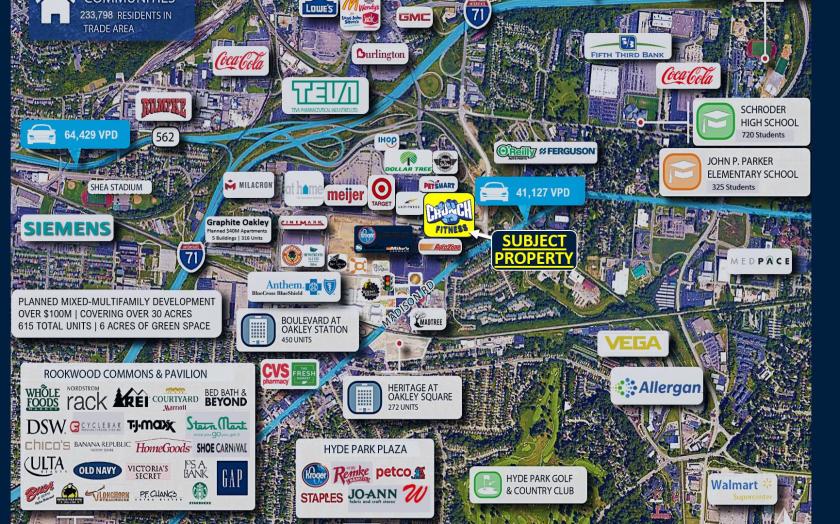
• Surrounding Retailers Include Meijer, Target, Cinemark, Chick-fil-A, Starbucks, and Olive Garden
• Oakleys Millennial Population Wellness Generation Makes up 47 Percent of Population in One-Mile
Listing Agents

Joel Dumes
O: 513-878-7720
joel.dumes@marcusmillichap.com
O: 513-878-7720
joel.dumes@marcusmillichap.com

Stan Falk
Marcus & Millichap
O: 513-878-7721
stanton.falk@marcusmillichap.com
Marcus & Millichap
O: 513-878-7721
stanton.falk@marcusmillichap.com
While we strive to provide the most accurate information, all listing information, and demographic data, is provided by third-parties. As such, MyEListing will not be responsible for the accuracy of the information. It is strongly recommended that you verify all information with the listing agent, and any relevant agencies, prior to making any decisions.