Retail Space
785 Sunset Boulevard Corolla, NC 27927
785 Sunset Boulevard Corolla, NC 27927
Details & Description
Property Highlights
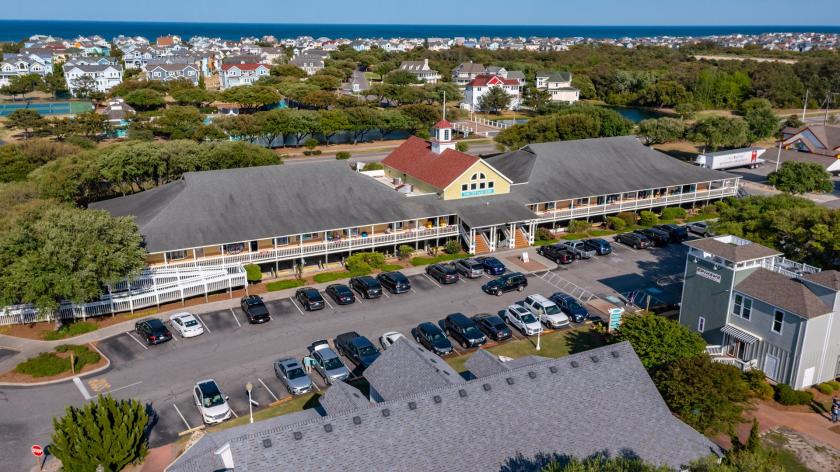
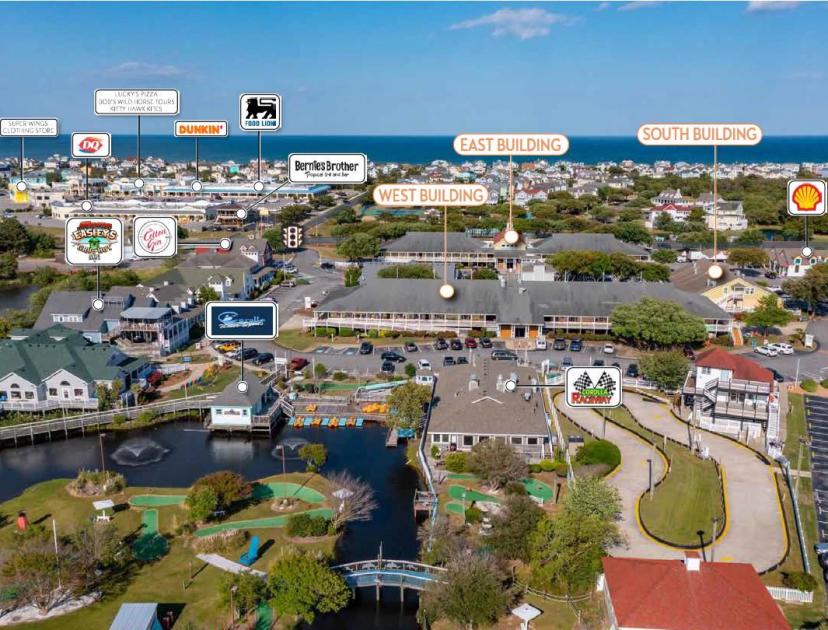
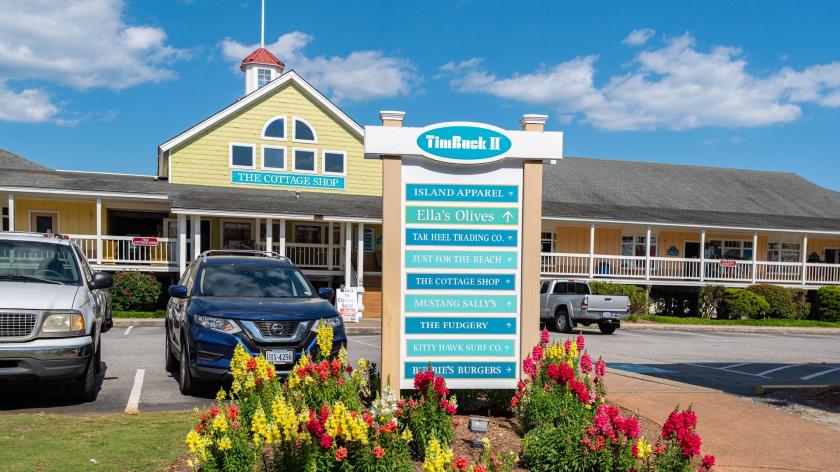
• Premier Shopping, Dining, and Entertainment Destination on Outer Banks of North Carolina
• Nearly 1.24 Million Visits and More than 766,000 Visitors in Past 12-Months
Listing Agents

Andrew Margulies
O: 312-327-5481
andrew.margulies@marcusmillichap.com
O: 312-327-5481
andrew.margulies@marcusmillichap.com

Charles Gallagher
Marcus & Millichap
O: 843-952-2252
charles.gallagher@marcusmillichap.com
Marcus & Millichap
O: 843-952-2252
charles.gallagher@marcusmillichap.com

Harrison Creason
Marcus & Millichap
O: 843-952-2257
harrison.creason@marcusmillichap.com
Marcus & Millichap
O: 843-952-2257
harrison.creason@marcusmillichap.com
While we strive to provide the most accurate information, all listing information, and demographic data, is provided by third-parties. As such, MyEListing will not be responsible for the accuracy of the information. It is strongly recommended that you verify all information with the listing agent, and any relevant agencies, prior to making any decisions.