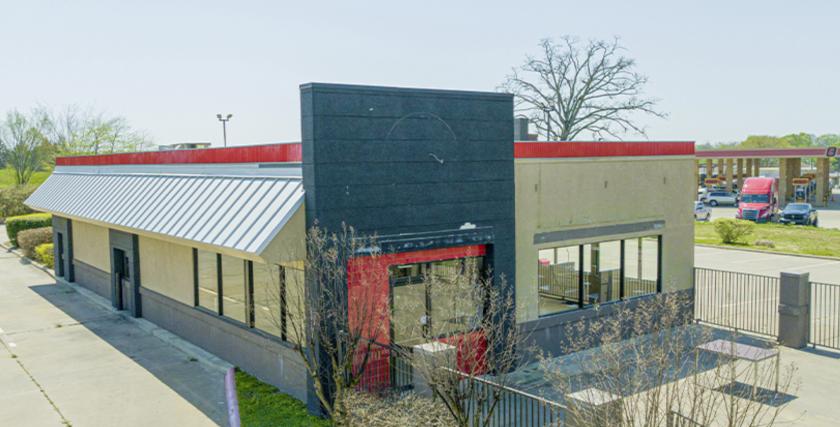
1-Mile | 3-Miles | 5-Miles | ||
---|---|---|---|---|
Total Population | 1,054 | 3,220 | 4,515 | |
Population Median Age | 36 | 38 | 40 | |
Population by Age | 0-9 Yrs | 180 (17%) | 520 (16%) | 616 (13%) |
10-19 Yrs | 149 (14%) | 450 (13%) | 643 (14%) | |
20-29 Yrs | 123 (11%) | 368 (11%) | 476 (10%) | |
30-39 Yrs | 193 (18%) | 529 (16%) | 616 (13%) | |
40-49 Yrs | 74 (7%) | 224 (6%) | 396 (8%) | |
50-59 Yrs | 111 (10%) | 361 (11%) | 584 (12%) | |
60-69 Yrs | 102 (9%) | 328 (10%) | 511 (11%) | |
70+ Yrs | 122 (11%) | 439 (13%) | 673 (14%) | |
Median HH Income | $43,817 | $44,915 | $47,016 | |
Total Household Income | < 24K | 92 (25%) | 270 (23%) | 345 (21%) |
25-49K | 130 (35%) | 400 (35%) | 544 (33%) | |
50-74K | 44 (12%) | 142 (12%) | 220 (13%) | |
75-99K | 42 (11%) | 133 (11%) | 205 (12%) | |
100-199K | 45 (12%) | 154 (13%) | 260 (15%) | |
200K+ | 8 (2%) | 31 (2%) | 63 (3%) | |
Highest Education Level | No Diploma | 120 | 331 | 376 |
Diploma or GED | 184 | 603 | 918 | |
Some College | 172 | 540 | 811 | |
Assoc. Degree | 57 | 169 | 240 | |
Bachelors Degree | 119 | 378 | 565 | |
Higher Degree | 27 | 88 | 144 | |
Total Housing Units | 442 | 1,535 | 2,437 | |
--Owner-Occupied | 233 | 768 | 1,203 | |
--Renter-Occupied | 129 | 361 | 434 | |
Owner-Occupied Values | < 100K | 119 | 366 | 525 |
100-199K | 101 | 334 | 493 | |
200-299K | 11 | 38 | 71 | |
300-399K | 3 | 19 | 71 | |
400-499K | 0 | 8 | 20 | |
500K+ | 0 | 2 | 23 | |
Total Working Age Population | 782 | 2,427 | 3,525 | |
In Work Force | 482 | 1,469 | 2,108 | |
Not In Work Force | 300 | 959 | 1,417 | |
Workforce Employed | 437 | 1,336 | 1,952 | |
Workforce Unemployed | 45 | 132 | 155 | |
Civlian Workforce | 482 | 1,469 | 2,108 | |
Military Workforce | 0 | 0 | 0 | |
Total Households | 362 | 1,129 | 1,637 | |
Family Households | 229 | 737 | 1,115 | |
Non-Family Households | 133 | 391 | 521 | |
Married Couple | 170 | 565 | 881 | |
Other Family | 59 | 173 | 234 | |
Married w/Child | 70 | 213 | 288 | |
Single Male w/Child | 0 | 1 | 5 | |
Single Female w/Child | 44 | 119 | 133 |
Population Change Last Two Decades - Plus Projection
2000 | % | 2010 | % | 2020 | % | 2030 | |
---|---|---|---|---|---|---|---|
Texas | 20,851,820 | +21 | 25,145,561 | +18 | 29,677,668 | +18 | 34,894,452 |
Franklin County | 9,458 | +12 | 10,605 | +3 | 10,924 | +2 | 11,138 |
Total Working Age Population:
Total Households:
Total Working Age Population:
Total Households:
Total Working Age Population:
Total Households: