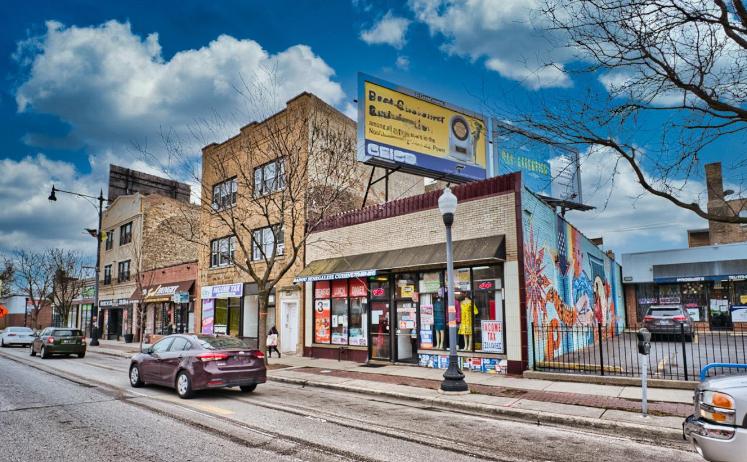
1-Mile | 3-Miles | 5-Miles | ||
---|---|---|---|---|
Total Population | 62,008 | 331,289 | 678,528 | |
Population Median Age | 38 | 38 | 39 | |
Population by Age | 0-9 Yrs | 8078 (13%) | 36009 (10%) | 75910 (11%) |
10-19 Yrs | 6646 (10%) | 40531 (12%) | 74644 (11%) | |
20-29 Yrs | 8259 (13%) | 55796 (16%) | 107303 (15%) | |
30-39 Yrs | 10562 (17%) | 49984 (15%) | 111362 (16%) | |
40-49 Yrs | 9092 (14%) | 40727 (12%) | 88638 (13%) | |
50-59 Yrs | 8257 (13%) | 40784 (12%) | 84264 (12%) | |
60-69 Yrs | 6211 (10%) | 34277 (10%) | 68248 (10%) | |
70+ Yrs | 4904 (7%) | 33181 (10%) | 68159 (10%) | |
Median HH Income | $57,633 | $58,221 | $66,624 | |
Total Household Income | < 24K | 5579 (21%) | 29488 (22%) | 52967 (19%) |
25-49K | 5810 (22%) | 28750 (21%) | 55013 (19%) | |
50-74K | 4568 (17%) | 21689 (16%) | 43620 (15%) | |
75-99K | 3064 (11%) | 13789 (10%) | 30741 (11%) | |
100-199K | 4838 (18%) | 27126 (20%) | 62306 (22%) | |
200K+ | 1682 (6%) | 11535 (8%) | 31204 (11%) | |
Highest Education Level | No Diploma | 5642 | 26059 | 50422 |
Diploma or GED | 8674 | 36941 | 75001 | |
Some College | 6930 | 33993 | 67880 | |
Assoc. Degree | 1908 | 12045 | 24570 | |
Bachelors Degree | 11485 | 64846 | 148753 | |
Higher Degree | 9557 | 52719 | 113498 | |
Total Housing Units | 28,203 | 147,538 | 303,690 | |
--Owner-Occupied | 9,942 | 59,836 | 133,171 | |
--Renter-Occupied | 15,599 | 72,542 | 142,678 | |
Owner-Occupied Values | < 100K | 905 | 4009 | 6534 |
100-199K | 2741 | 13379 | 22233 | |
200-299K | 2493 | 14533 | 28955 | |
300-399K | 1561 | 11445 | 26604 | |
400-499K | 1096 | 6184 | 15174 | |
500K+ | 1146 | 10286 | 33671 | |
Total Working Age Population | 49,911 | 276,122 | 562,161 | |
In Work Force | 34,064 | 175,487 | 373,934 | |
Not In Work Force | 15,847 | 100,636 | 188,227 | |
Workforce Employed | 32,515 | 165,699 | 356,056 | |
Workforce Unemployed | 1,524 | 9,725 | 17,677 | |
Civlian Workforce | 34,040 | 175,424 | 373,732 | |
Military Workforce | 24 | 63 | 202 | |
Total Households | 25,540 | 132,378 | 275,849 | |
Family Households | 13,549 | 65,974 | 142,904 | |
Non-Family Households | 11,991 | 66,403 | 132,946 | |
Married Couple | 9,256 | 48,288 | 108,776 | |
Other Family | 4,293 | 17,686 | 34,128 | |
Married w/Child | 4,167 | 19,746 | 45,922 | |
Single Male w/Child | 583 | 2,015 | 4,058 | |
Single Female w/Child | 1,680 | 5,810 | 11,184 |
Population Change Last Two Decades - Plus Projection
2000 | % | 2010 | % | 2020 | % | 2030 | |
---|---|---|---|---|---|---|---|
Illinois | 12,419,293 | +3 | 12,830,632 | +12 | 14,316,487 | +6 | 15,138,849 |
Cook County | 5,376,741 | -3 | 5,194,675 | +10 | 5,707,832 | +5 | 5,990,243 |
Total Working Age Population:
Total Households:
Total Working Age Population:
Total Households:
Total Working Age Population:
Total Households: