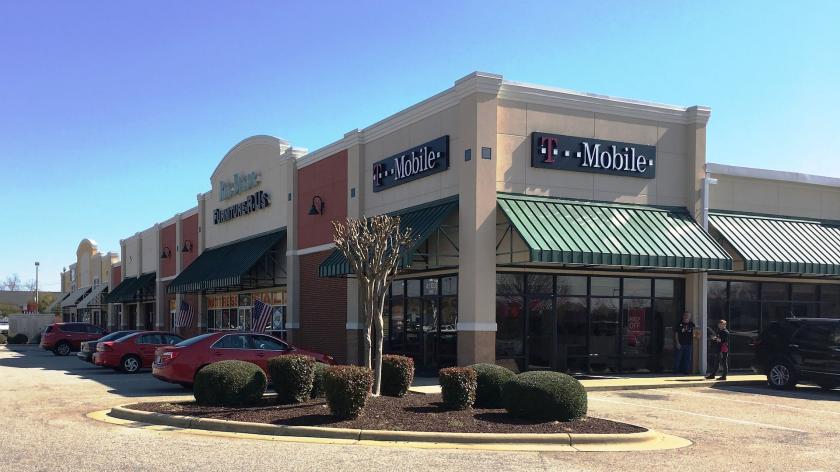
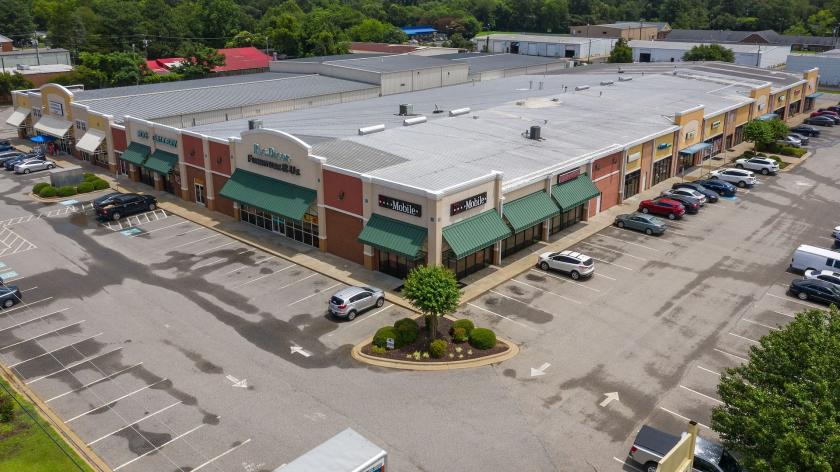
Retail Space
4101 Raeford Road Fayetteville, NC 28304
4101 Raeford Road Fayetteville, NC 28304
Details & Description
Property Highlights
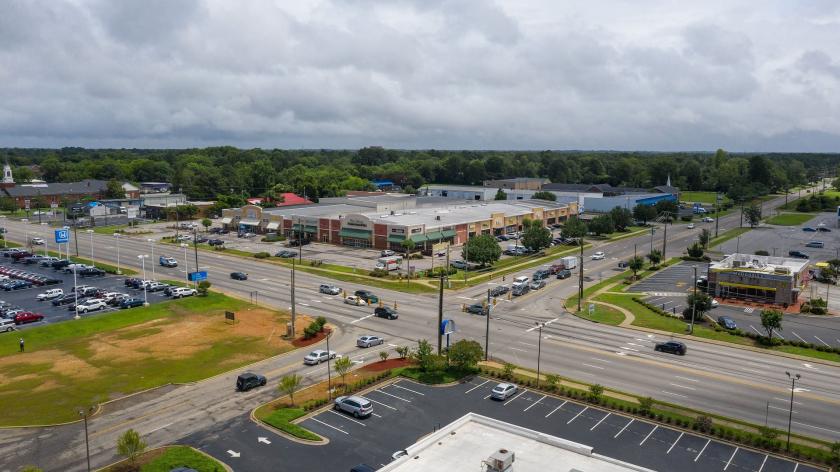
• Six Miles South of Fort Bragg - The Largest Military Base in the Country
• Easy Access with No Turn Restrictions - Signalized Hard Intersection
Listing Agents

Donald Gilchrist
O: 919-674-1104
donald.gilchrist@marcusmillichap.com
O: 919-674-1104
donald.gilchrist@marcusmillichap.com
While we strive to provide the most accurate information, all listing information, and demographic data, is provided by third-parties. As such, MyEListing will not be responsible for the accuracy of the information. It is strongly recommended that you verify all information with the listing agent, and any relevant agencies, prior to making any decisions.