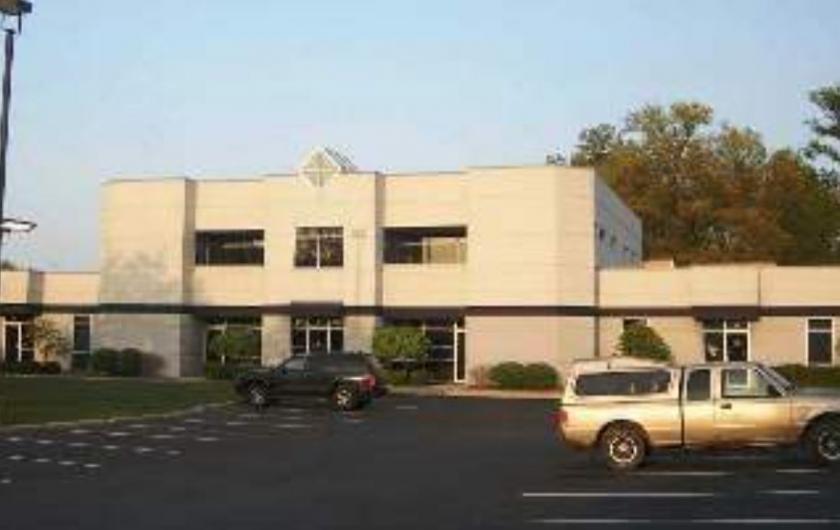
1-Mile | 3-Miles | 5-Miles | ||
---|---|---|---|---|
Total Population | 9,742 | 63,517 | 155,087 | |
Population Median Age | 43 | 42 | 40 | |
Population by Age | 0-9 Yrs | 1101 (11%) | 7908 (12%) | 20065 (12%) |
10-19 Yrs | 938 (9%) | 7055 (11%) | 17082 (11%) | |
20-29 Yrs | 1186 (12%) | 6413 (10%) | 18794 (12%) | |
30-39 Yrs | 1210 (12%) | 8218 (12%) | 21873 (14%) | |
40-49 Yrs | 1202 (12%) | 7807 (12%) | 18461 (11%) | |
50-59 Yrs | 1321 (13%) | 9062 (14%) | 20584 (13%) | |
60-69 Yrs | 1210 (12%) | 8272 (13%) | 20792 (13%) | |
70+ Yrs | 1574 (16%) | 8780 (13%) | 17436 (11%) | |
Median HH Income | $74,601 | $80,811 | $66,071 | |
Total Household Income | < 24K | 678 (16%) | 3895 (14%) | 12652 (18%) |
25-49K | 802 (19%) | 5006 (18%) | 13655 (20%) | |
50-74K | 628 (14%) | 3505 (13%) | 10558 (15%) | |
75-99K | 525 (12%) | 3820 (14%) | 8543 (12%) | |
100-199K | 1162 (27%) | 7099 (26%) | 14848 (22%) | |
200K+ | 403 (9%) | 3263 (12%) | 6713 (10%) | |
Highest Education Level | No Diploma | 339 | 2378 | 7683 |
Diploma or GED | 1349 | 9212 | 23500 | |
Some College | 1467 | 7853 | 19153 | |
Assoc. Degree | 519 | 3399 | 8427 | |
Bachelors Degree | 2191 | 13379 | 29914 | |
Higher Degree | 1399 | 9888 | 21942 | |
Total Housing Units | 4,601 | 28,412 | 72,540 | |
--Owner-Occupied | 2,746 | 19,128 | 41,374 | |
--Renter-Occupied | 1,453 | 7,461 | 25,596 | |
Owner-Occupied Values | < 100K | 301 | 1698 | 6345 |
100-199K | 1038 | 7328 | 15239 | |
200-299K | 438 | 3408 | 6947 | |
300-399K | 376 | 2561 | 4729 | |
400-499K | 294 | 1511 | 2632 | |
500K+ | 298 | 2621 | 5481 | |
Total Working Age Population | 8,067 | 51,329 | 124,147 | |
In Work Force | 5,289 | 33,784 | 83,125 | |
Not In Work Force | 2,778 | 17,545 | 41,022 | |
Workforce Employed | 5,099 | 32,680 | 79,519 | |
Workforce Unemployed | 190 | 1,079 | 3,581 | |
Civlian Workforce | 5,289 | 33,759 | 83,100 | |
Military Workforce | 0 | 25 | 25 | |
Total Households | 4,198 | 26,588 | 66,970 | |
Family Households | 2,605 | 16,941 | 39,699 | |
Non-Family Households | 1,593 | 9,647 | 27,270 | |
Married Couple | 1,867 | 13,371 | 29,137 | |
Other Family | 739 | 3,570 | 10,563 | |
Married w/Child | 686 | 5,320 | 11,982 | |
Single Male w/Child | 113 | 445 | 1,012 | |
Single Female w/Child | 229 | 1,233 | 3,985 |
Population Change Last Two Decades - Plus Projection
2000 | % | 2010 | % | 2020 | % | 2030 | |
---|---|---|---|---|---|---|---|
Ohio | 11,353,140 | +2 | 11,536,504 | 0 | 11,574,870 | 0 | 11,615,100 |
Clermont County | 177,977 | +11 | 197,363 | +6 | 208,330 | +3 | 214,090 |
Hamilton County | 845,303 | -5 | 802,374 | -1 | 790,600 | -1 | 785,900 |
Warren County | 158,383 | +34 | 212,693 | +6 | 225,770 | +4 | 235,640 |
Total Working Age Population:
Total Households:
Total Working Age Population:
Total Households:
Total Working Age Population:
Total Households: