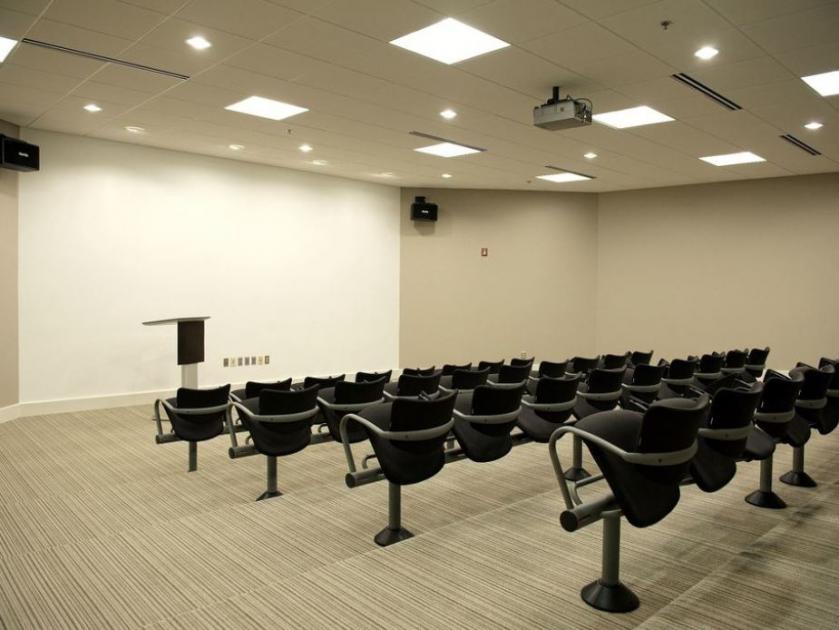
Each building has three high speed, computerized elevators - split door cab with granite flooring, fabric wall coverings and polished stainless-steel finish. Advanced energy efficient computerized HVAC system with 24 hour, seven-day-a-week climate control system provided to each tenant suite. Individual zoning for every 400 SF. Sophisticated fire safety system equipped with smoke detectors and sprinkler system, continually monitored by the City of Independence Fire Department. Newly Renovated Common Amenities include a 40-seat amphitheater equipped with an overhead projector, screen, and seats with drop arm desks. The Training Room can be arranged to accommodate classroom or boardroom style seating for 48 people. In Building II, a 24-seat tiered meeting room equipped with Wi-Fi also has seats with drop arm desks. The Breakout Area is a terrific location for pre or post meeting events. State of the art Fitness Center is equipped with cardio, strength training machines, free weights, and an aerobic area. Men's and Women's locker rooms are equipped with shower facilities. An in-building cafe serving breakfast and lunch is located in Building I. Catering for corporate events is also available. Tenants control access 24 hours a day, seven days per week through the use of a key card system. During off hours visitors can access the building through an intercom/buzzer system. Tenants access conference room reservations and work orders through an electronic portal for ease of access.