Flex-Office-Warehouse
3905 South Western Avenue Sioux Falls, SD 57105
3905 South Western Avenue Sioux Falls, SD 57105
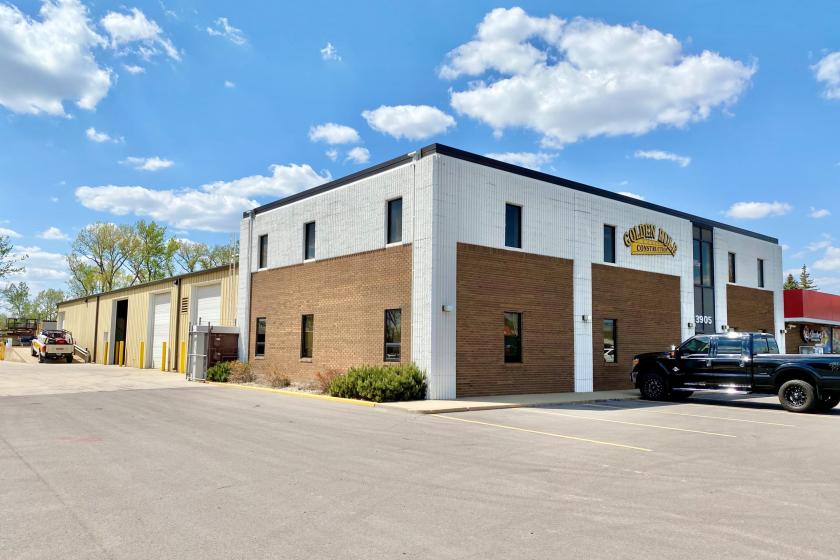
Details & Description
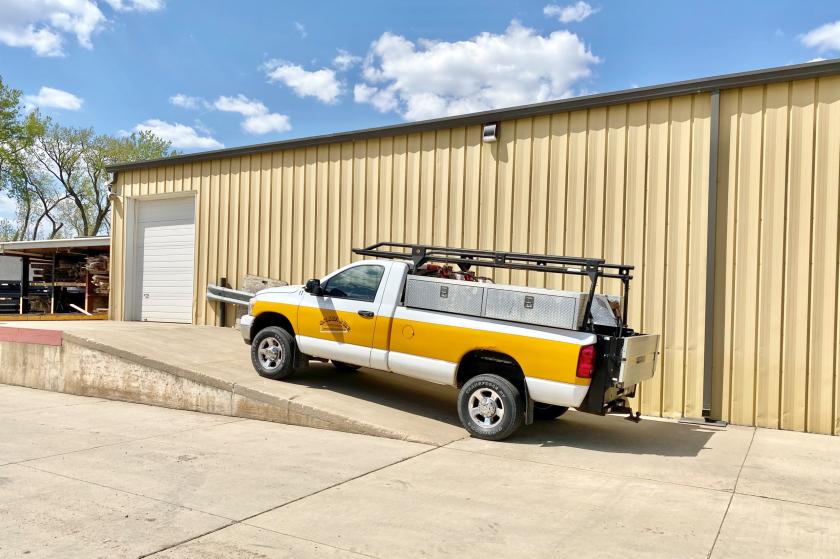
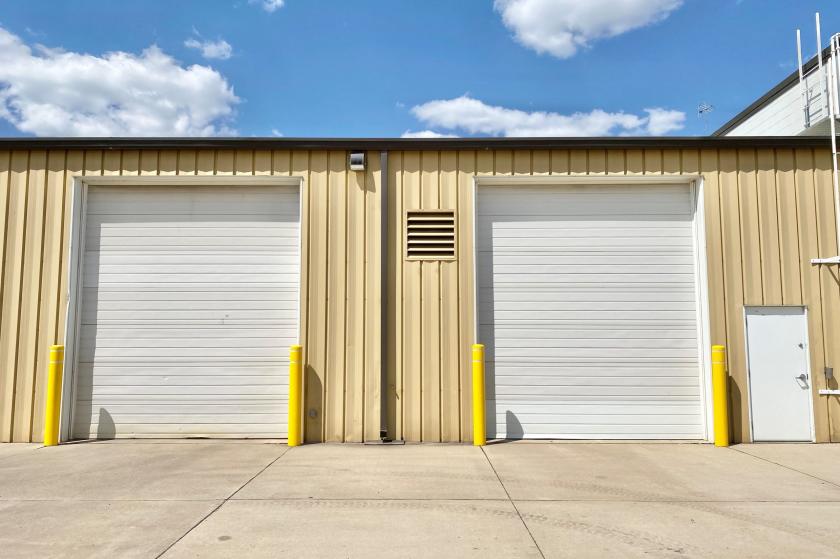
Additional Photos

Listing Agents

Alex Soundy
O: 605-681-8351
M: 605-376-3700
alex@benderco.com
O: 605-681-8351
M: 605-376-3700
alex@benderco.com
While we strive to provide the most accurate information, all listing information, and demographic data, is provided by third-parties. As such, MyEListing will not be responsible for the accuracy of the information. It is strongly recommended that you verify all information with the listing agent, and any relevant agencies, prior to making any decisions.


