Retail Space
1650 Limekiln Pike Dresher, PA 19025
1650 Limekiln Pike Dresher, PA 19025
Details & Description
Property Highlights
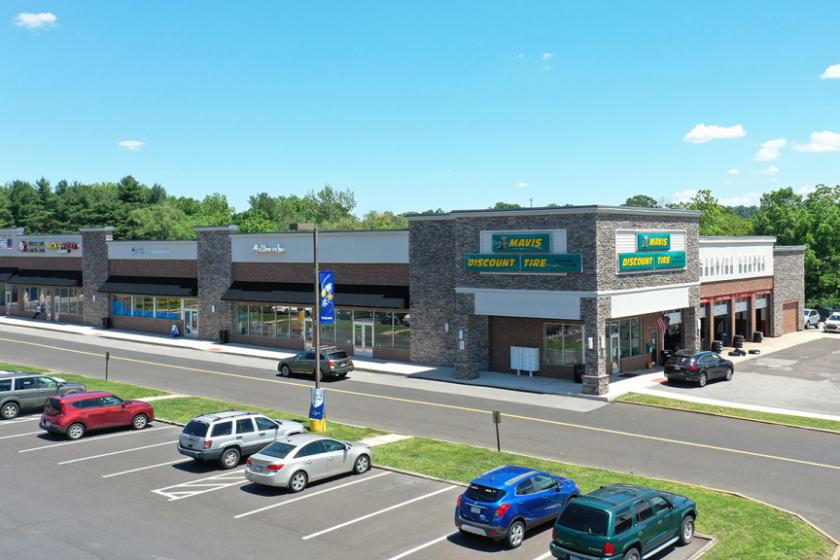
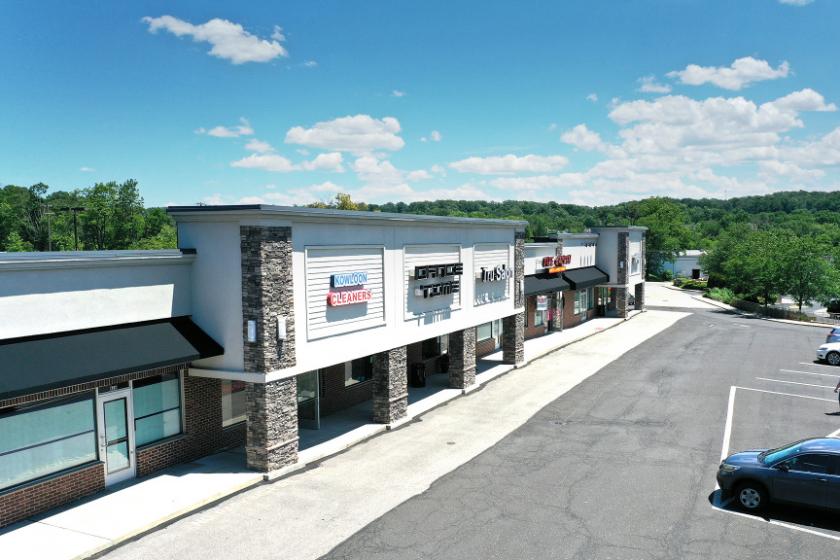
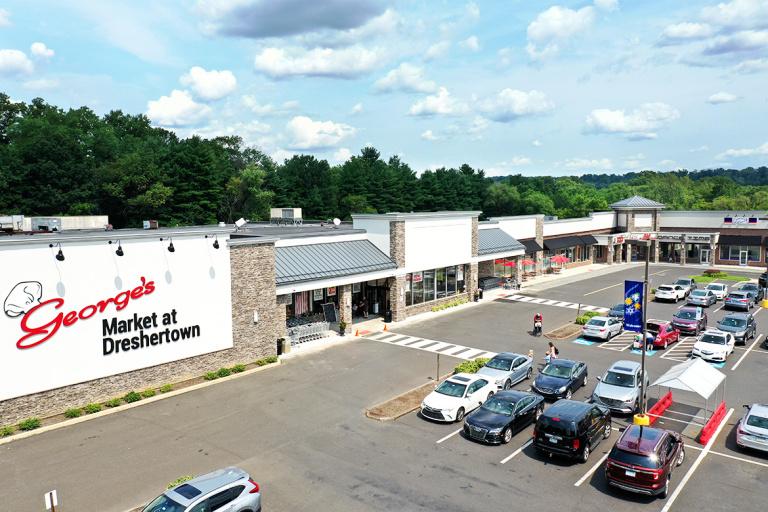
• Grocery anchored neighborhood center with desirable mix of retail and service-oreiented tenants
• Situated nearby high-income neighborhoods and large employers
Listing Agents

Arlene Gray
O: 717-723-4489
agray@paramountrealtypa.com
O: 717-723-4489
agray@paramountrealtypa.com

Kristi Pennington
LMS Commercial Real Estate
O: 717-569-9373
kpennington@lms-pma.com
LMS Commercial Real Estate
O: 717-569-9373
kpennington@lms-pma.com
While we strive to provide the most accurate information, all listing information, and demographic data, is provided by third-parties. As such, MyEListing will not be responsible for the accuracy of the information. It is strongly recommended that you verify all information with the listing agent, and any relevant agencies, prior to making any decisions.