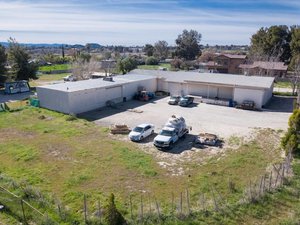
1-Mile | 3-Miles | 5-Miles | ||
---|---|---|---|---|
Total Population | 16,810 | 120,752 | 264,285 | |
Population Median Age | 32 | 32 | 32 | |
Population by Age | 0-9 Yrs | 3081 (18%) | 20675 (17%) | 45261 (17%) |
10-19 Yrs | 2805 (16%) | 20944 (17%) | 44406 (16%) | |
20-29 Yrs | 2322 (13%) | 20612 (17%) | 46301 (17%) | |
30-39 Yrs | 2569 (15%) | 16665 (13%) | 36296 (13%) | |
40-49 Yrs | 2154 (12%) | 14319 (11%) | 31141 (11%) | |
50-59 Yrs | 1841 (10%) | 12827 (10%) | 28186 (10%) | |
60-69 Yrs | 1201 (7%) | 8531 (7%) | 18490 (6%) | |
70+ Yrs | 837 (4%) | 6179 (5%) | 14203 (5%) | |
Median HH Income | $44,462 | $47,586 | $47,105 | |
Total Household Income | < 24K | 1533 (27%) | 8281 (24%) | 18518 (26%) |
25-49K | 1489 (27%) | 9463 (28%) | 18869 (26%) | |
50-74K | 718 (13%) | 5959 (17%) | 12721 (18%) | |
75-99K | 856 (15%) | 4333 (12%) | 8412 (11%) | |
100-199K | 880 (15%) | 4898 (14%) | 10750 (15%) | |
200K+ | 31 (0%) | 554 (1%) | 1276 (1%) | |
Highest Education Level | No Diploma | 2135 | 19617 | 47143 |
Diploma or GED | 3032 | 21343 | 45414 | |
Some College | 2669 | 15001 | 32790 | |
Assoc. Degree | 777 | 4529 | 9487 | |
Bachelors Degree | 802 | 5220 | 11215 | |
Higher Degree | 408 | 2274 | 4536 | |
Total Housing Units | 5,824 | 35,431 | 75,168 | |
--Owner-Occupied | 2,339 | 16,433 | 34,296 | |
--Renter-Occupied | 3,168 | 17,054 | 36,250 | |
Owner-Occupied Values | < 100K | 129 | 820 | 3458 |
100-199K | 416 | 3498 | 6282 | |
200-299K | 1032 | 7340 | 13129 | |
300-399K | 522 | 3527 | 8001 | |
400-499K | 155 | 792 | 2408 | |
500K+ | 85 | 456 | 1019 | |
Total Working Age Population | 11,739 | 87,350 | 192,185 | |
In Work Force | 7,551 | 53,871 | 115,493 | |
Not In Work Force | 4,188 | 33,478 | 76,692 | |
Workforce Employed | 6,763 | 48,014 | 103,616 | |
Workforce Unemployed | 788 | 5,833 | 11,831 | |
Civlian Workforce | 7,551 | 53,846 | 115,447 | |
Military Workforce | 0 | 25 | 46 | |
Total Households | 5,507 | 33,487 | 70,546 | |
Family Households | 3,756 | 25,292 | 54,172 | |
Non-Family Households | 1,750 | 8,196 | 16,374 | |
Married Couple | 1,917 | 13,561 | 29,785 | |
Other Family | 1,840 | 11,731 | 24,386 | |
Married w/Child | 988 | 7,080 | 15,583 | |
Single Male w/Child | 253 | 1,689 | 3,267 | |
Single Female w/Child | 857 | 4,548 | 9,943 |
Population Change Last Two Decades - Plus Projection
2000 | % | 2010 | % | 2020 | % | 2030 | |
---|---|---|---|---|---|---|---|
California | 33,871,648 | +10 | 37,253,956 | +9 | 40,467,295 | +8 | 43,631,295 |
San Bernardino County | 1,709,434 | +19 | 2,035,210 | +9 | 2,223,189 | +11 | 2,468,202 |
Total Working Age Population:
Total Households:
Total Working Age Population:
Total Households:
Total Working Age Population:
Total Households: