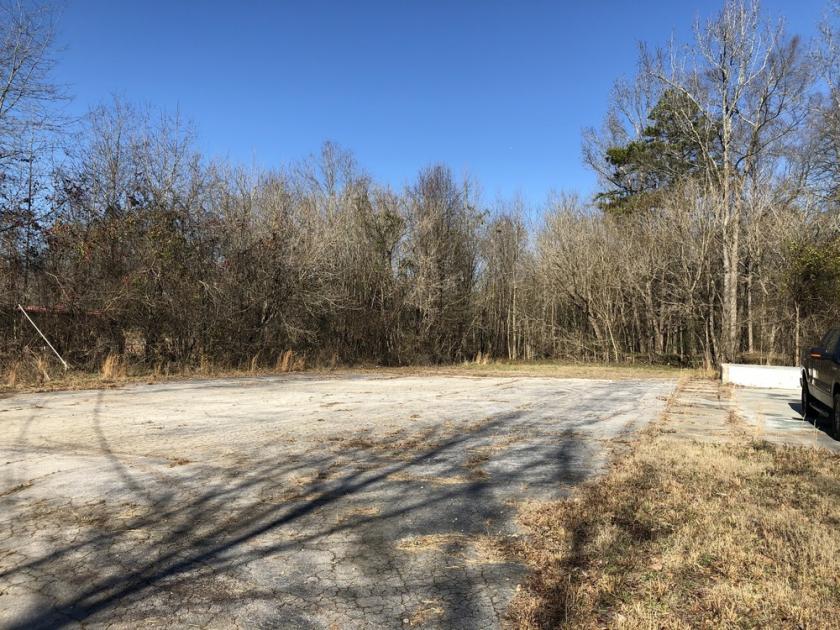
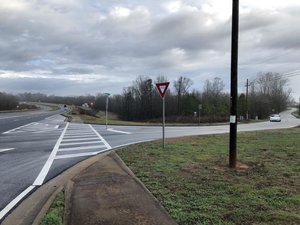
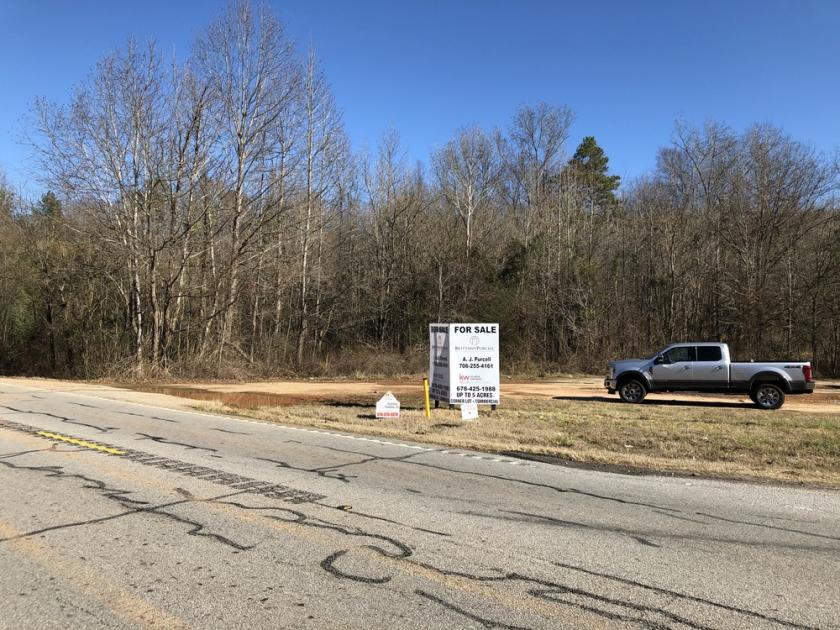
1-Mile | 3-Miles | 5-Miles | ||
---|---|---|---|---|
Total Population | 1,480 | 11,046 | 35,004 | |
Population Median Age | 38 | 37 | 36 | |
Population by Age | 0-9 Yrs | 227 (15%) | 1857 (16%) | 5632 (16%) |
10-19 Yrs | 182 (12%) | 1295 (11%) | 4563 (13%) | |
20-29 Yrs | 165 (11%) | 1208 (10%) | 4247 (12%) | |
30-39 Yrs | 179 (12%) | 1504 (13%) | 4792 (13%) | |
40-49 Yrs | 235 (15%) | 1604 (14%) | 4818 (13%) | |
50-59 Yrs | 175 (11%) | 1480 (13%) | 4739 (13%) | |
60-69 Yrs | 150 (10%) | 1084 (9%) | 3340 (9%) | |
70+ Yrs | 167 (11%) | 1014 (9%) | 2873 (8%) | |
Median HH Income | $62,435 | $71,086 | $66,688 | |
Total Household Income | < 24K | 84 (15%) | 465 (12%) | 1955 (16%) |
25-49K | 136 (25%) | 783 (20%) | 2435 (20%) | |
50-74K | 105 (19%) | 753 (20%) | 2276 (19%) | |
75-99K | 81 (15%) | 659 (17%) | 1867 (15%) | |
100-199K | 104 (19%) | 906 (24%) | 2697 (23%) | |
200K+ | 16 (3%) | 173 (4%) | 467 (3%) | |
Highest Education Level | No Diploma | 66 | 620 | 2779 |
Diploma or GED | 363 | 2560 | 7874 | |
Some College | 248 | 1758 | 5293 | |
Assoc. Degree | 81 | 691 | 2076 | |
Bachelors Degree | 143 | 1112 | 3240 | |
Higher Degree | 80 | 586 | 1713 | |
Total Housing Units | 552 | 3,916 | 12,468 | |
--Owner-Occupied | 438 | 3,176 | 9,005 | |
--Renter-Occupied | 88 | 562 | 2,691 | |
Owner-Occupied Values | < 100K | 17 | 210 | 1164 |
100-199K | 264 | 1593 | 4171 | |
200-299K | 80 | 708 | 2044 | |
300-399K | 47 | 404 | 976 | |
400-499K | 27 | 178 | 394 | |
500K+ | 4 | 83 | 256 | |
Total Working Age Population | 1,133 | 8,367 | 26,442 | |
In Work Force | 655 | 5,197 | 17,114 | |
Not In Work Force | 477 | 3,169 | 9,328 | |
Workforce Employed | 633 | 5,043 | 16,456 | |
Workforce Unemployed | 22 | 154 | 657 | |
Civlian Workforce | 655 | 5,197 | 17,113 | |
Military Workforce | 0 | 0 | 1 | |
Total Households | 526 | 3,738 | 11,696 | |
Family Households | 379 | 2,937 | 9,049 | |
Non-Family Households | 147 | 801 | 2,647 | |
Married Couple | 319 | 2,524 | 7,192 | |
Other Family | 60 | 413 | 1,857 | |
Married w/Child | 148 | 1,168 | 3,231 | |
Single Male w/Child | 7 | 57 | 262 | |
Single Female w/Child | 17 | 115 | 564 |
Population Change Last Two Decades - Plus Projection
2000 | % | 2010 | % | 2020 | % | 2030 | |
---|---|---|---|---|---|---|---|
Georgia | 8,186,453 | +18 | 9,687,653 | +12 | 10,833,472 | +13 | 12,292,423 |
Barrow County | 46,144 | +50 | 69,367 | +25 | 86,383 | +35 | 116,916 |
Hall County | 139,277 | +29 | 179,684 | +15 | 206,349 | +13 | 232,775 |
Jackson County | 41,589 | +45 | 60,485 | +24 | 74,700 | +28 | 95,493 |
Total Working Age Population:
Total Households:
Total Working Age Population:
Total Households:
Total Working Age Population:
Total Households: