Industrial Properties
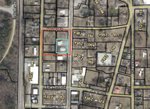
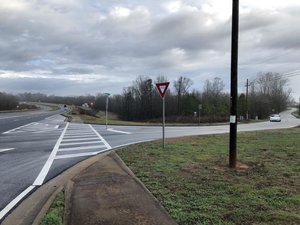
2615 U.S. 411 Fairmount, GA 30139
2615 U.S. 411 Fairmount, GA 30139

Details & Description
Listing Agents

Alexander Purcell
KW Commercial
O: 706-255-4161
aj@brittanysells.com
KW Commercial
O: 706-255-4161
aj@brittanysells.com
While we strive to provide the most accurate information, all listing information, and demographic data, is provided by third-parties. As such, MyEListing will not be responsible for the accuracy of the information. It is strongly recommended that you verify all information with the listing agent, and any relevant agencies, prior to making any decisions.