Industrial Properties
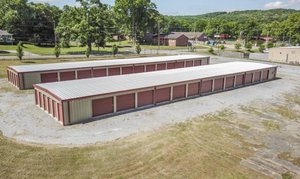
196 North Avenue Northeast Rome, GA 30161
196 North Avenue Northeast Rome, GA 30161

Details & Description
Listing Agents

Joseph Willingham
KW Commercial
O: 770-880-5524
M: 706-252-0909
joseph@willinghamgroup.com
KW Commercial
O: 770-880-5524
M: 706-252-0909
joseph@willinghamgroup.com
While we strive to provide the most accurate information, all listing information, and demographic data, is provided by third-parties. As such, MyEListing will not be responsible for the accuracy of the information. It is strongly recommended that you verify all information with the listing agent, and any relevant agencies, prior to making any decisions.