Retail Space
8849 North Tarrant Parkway North Richland Hills, TX 76182
8849 North Tarrant Parkway North Richland Hills, TX 76182
Details & Description
Property Highlights
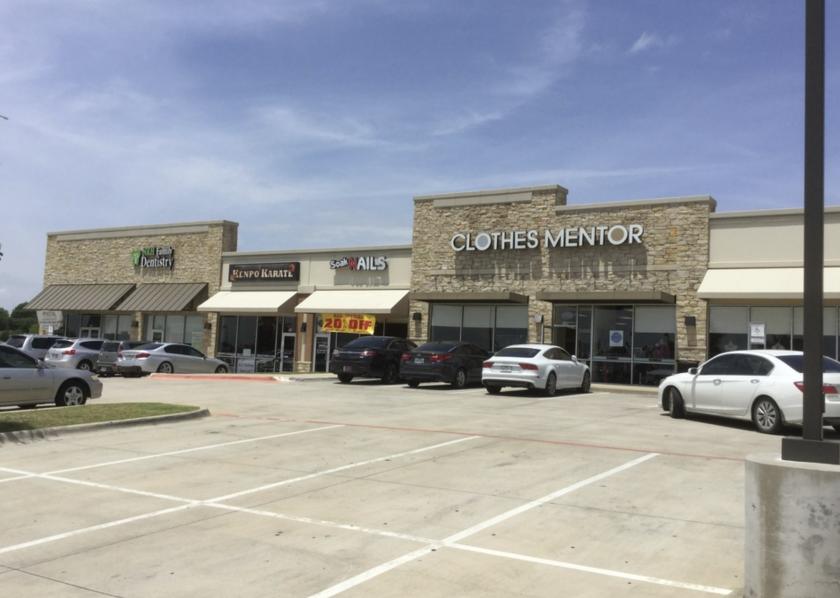
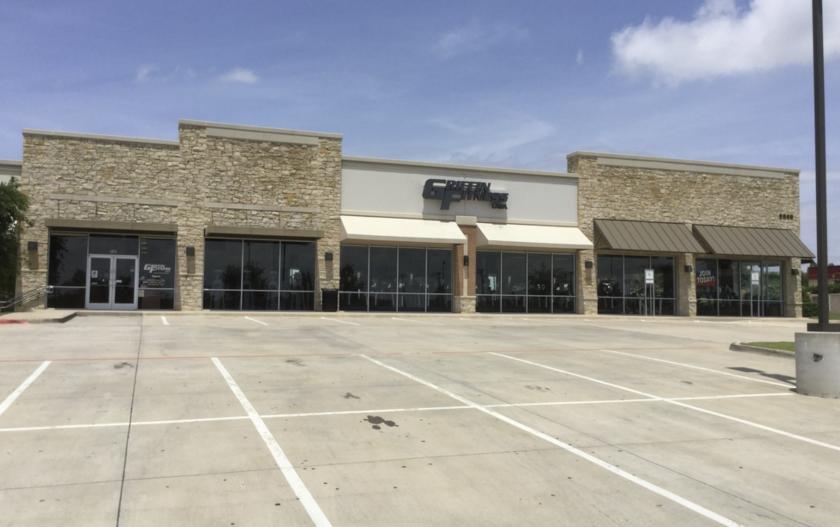
- • Former Fitness Center
- • Extremely Strong Demographics
- • End Cap in A Class Shopping Center
- • Traffic Counts of over 43,000
- • Overly Parked with 123 Parking Spots
Listing Agents

Aaron Wimberly
O: 817-999-7348
aaron.wimberly@kw.com
O: 817-999-7348
aaron.wimberly@kw.com
While we strive to provide the most accurate information, all listing information, and demographic data, is provided by third-parties. As such, MyEListing will not be responsible for the accuracy of the information. It is strongly recommended that you verify all information with the listing agent, and any relevant agencies, prior to making any decisions.