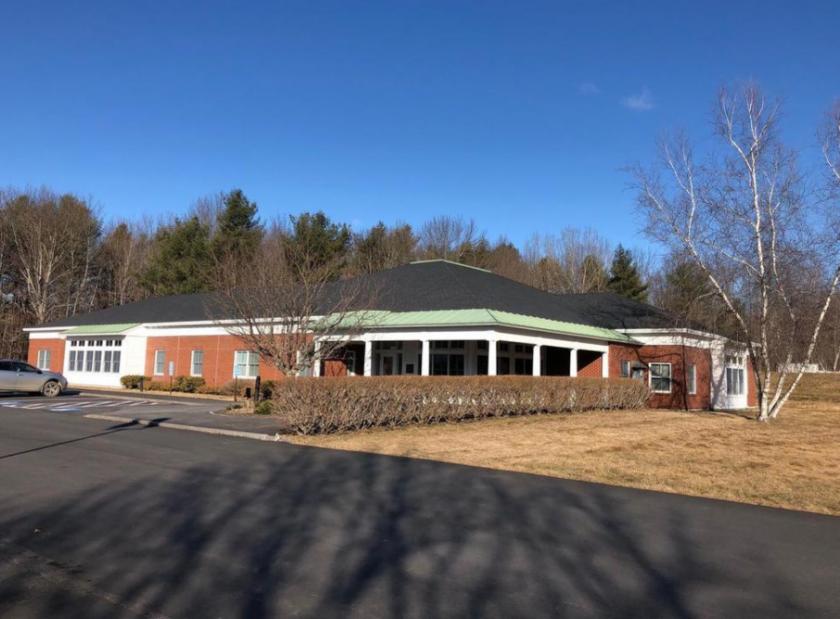
Office Space
16 Association Drive Manchester, ME 04351
16 Association Drive Manchester, ME 04351
Details & Description
Property Highlights
- • JUST OFF ROUTE 202 ON PRIVATE DRIVE
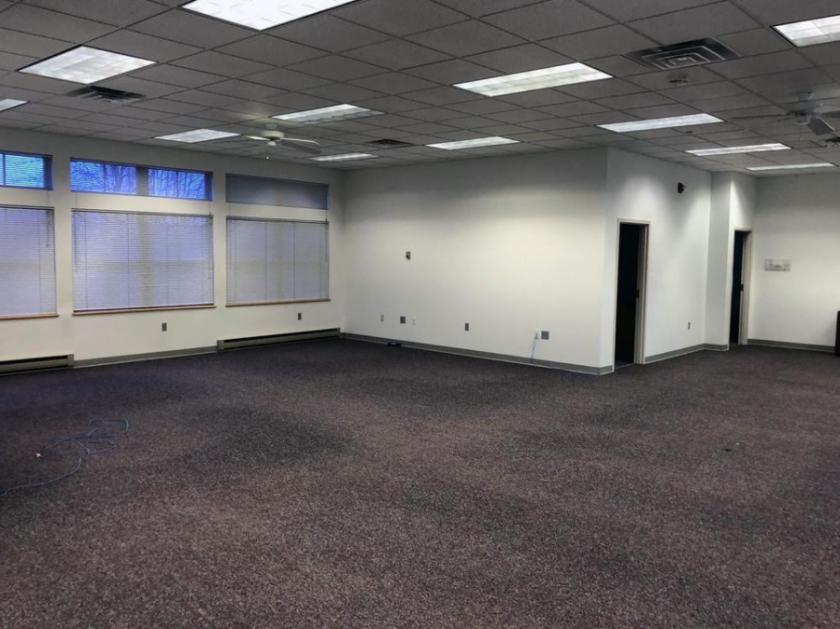
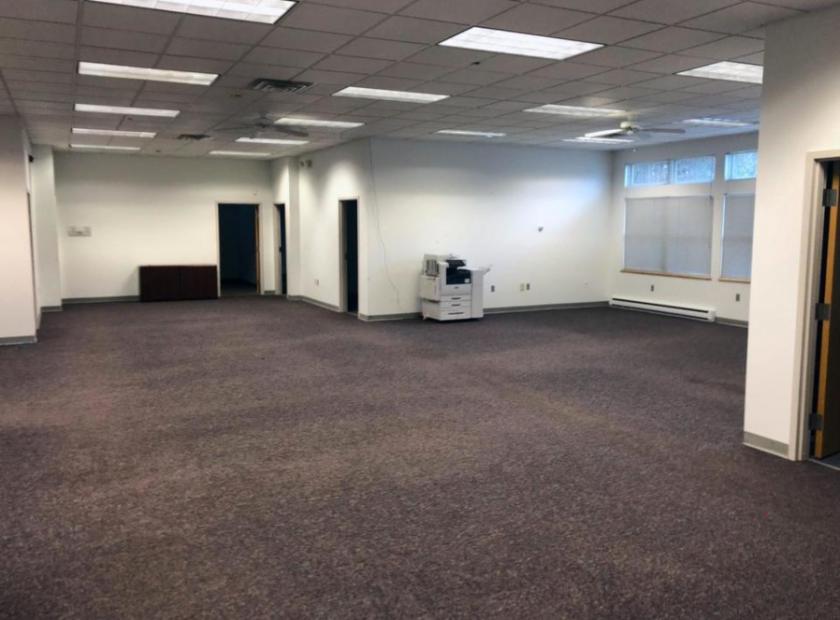
- • MULTIPLE PRIVATE OFFICES OPEN SPACE
- • LESS THAN 3 MILES TO MAINE TURNPIKE
- • SHARED KITCHEN LARGE CONFERENCE ROOM
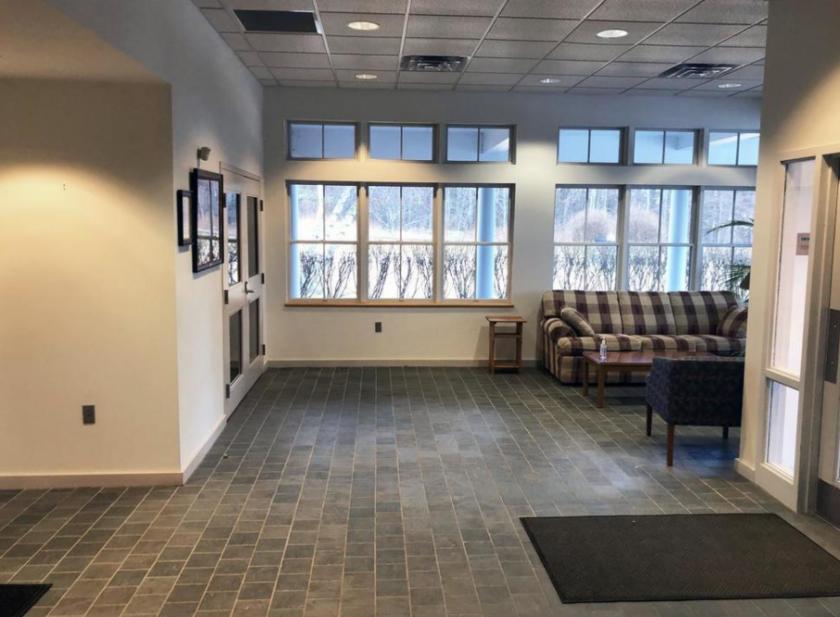
Additional Photos

Listing Agents

Dennis Wheelock
O: 207-242-5588
M: 207-774-7715
dwheelock@kw.com
O: 207-242-5588
M: 207-774-7715
dwheelock@kw.com
While we strive to provide the most accurate information, all listing information, and demographic data, is provided by third-parties. As such, MyEListing will not be responsible for the accuracy of the information. It is strongly recommended that you verify all information with the listing agent, and any relevant agencies, prior to making any decisions.


