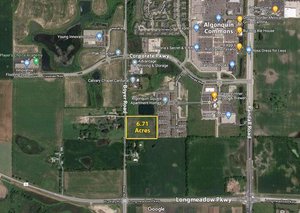
1-Mile | 3-Miles | 5-Miles | ||
---|---|---|---|---|
Total Population | 5,434 | 38,856 | 95,289 | |
Population Median Age | 39 | 37 | 38 | |
Population by Age | 0-9 Yrs | 580 (10%) | 5291 (13%) | 12276 (12%) |
10-19 Yrs | 781 (14%) | 6481 (16%) | 14504 (15%) | |
20-29 Yrs | 727 (13%) | 3966 (10%) | 10270 (10%) | |
30-39 Yrs | 564 (10%) | 4607 (11%) | 11651 (12%) | |
40-49 Yrs | 964 (17%) | 7023 (18%) | 14805 (15%) | |
50-59 Yrs | 709 (13%) | 4874 (12%) | 14166 (14%) | |
60-69 Yrs | 690 (12%) | 3535 (9%) | 9081 (9%) | |
70+ Yrs | 419 (7%) | 3078 (7%) | 8536 (8%) | |
Median HH Income | $79,689 | $101,667 | $98,719 | |
Total Household Income | < 24K | 233 (11%) | 1060 (8%) | 2750 (8%) |
25-49K | 209 (10%) | 1191 (9%) | 3762 (11%) | |
50-74K | 533 (25%) | 2088 (15%) | 5279 (15%) | |
75-99K | 328 (15%) | 2144 (16%) | 5238 (15%) | |
100-199K | 613 (29%) | 5163 (39%) | 12375 (36%) | |
200K+ | 157 (7%) | 1546 (11%) | 4118 (12%) | |
Highest Education Level | No Diploma | 265 | 1170 | 2892 |
Diploma or GED | 894 | 5153 | 13259 | |
Some College | 817 | 5408 | 14186 | |
Assoc. Degree | 252 | 2244 | 5749 | |
Bachelors Degree | 994 | 7764 | 18858 | |
Higher Degree | 471 | 2996 | 7994 | |
Total Housing Units | 2,369 | 13,810 | 34,834 | |
--Owner-Occupied | 1,559 | 11,500 | 29,097 | |
--Renter-Occupied | 515 | 1,692 | 4,424 | |
Owner-Occupied Values | < 100K | 12 | 174 | 732 |
100-199K | 413 | 2154 | 6691 | |
200-299K | 781 | 5482 | 12661 | |
300-399K | 316 | 2723 | 6435 | |
400-499K | 23 | 668 | 1780 | |
500K+ | 14 | 298 | 798 | |
Total Working Age Population | 4,380 | 29,412 | 73,833 | |
In Work Force | 3,236 | 21,113 | 52,508 | |
Not In Work Force | 1,144 | 8,299 | 21,325 | |
Workforce Employed | 3,127 | 20,519 | 50,833 | |
Workforce Unemployed | 109 | 594 | 1,652 | |
Civlian Workforce | 3,236 | 21,113 | 52,485 | |
Military Workforce | 0 | 0 | 23 | |
Total Households | 2,074 | 13,192 | 33,522 | |
Family Households | 1,554 | 10,540 | 25,901 | |
Non-Family Households | 520 | 2,651 | 7,621 | |
Married Couple | 1,285 | 9,043 | 22,035 | |
Other Family | 269 | 1,497 | 3,866 | |
Married w/Child | 608 | 4,858 | 10,926 | |
Single Male w/Child | 35 | 300 | 640 | |
Single Female w/Child | 99 | 548 | 1,322 |
Population Change Last Two Decades - Plus Projection
2000 | % | 2010 | % | 2020 | % | 2030 | |
---|---|---|---|---|---|---|---|
Illinois | 12,419,293 | +3 | 12,830,632 | +12 | 14,316,487 | +6 | 15,138,849 |
Kane County | 404,119 | +28 | 515,269 | +22 | 630,563 | +8 | 679,403 |
McHenry County | 260,077 | +19 | 308,760 | +32 | 407,931 | +9 | 443,398 |
Total Working Age Population:
Total Households:
Total Working Age Population:
Total Households:
Total Working Age Population:
Total Households: