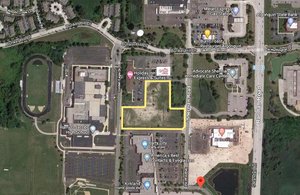
1-Mile | 3-Miles | 5-Miles | ||
---|---|---|---|---|
Total Population | 5,089 | 40,859 | 98,312 | |
Population Median Age | 39 | 39 | 38 | |
Population by Age | 0-9 Yrs | 537 (10%) | 5080 (12%) | 12417 (12%) |
10-19 Yrs | 714 (14%) | 5607 (13%) | 14143 (14%) | |
20-29 Yrs | 729 (14%) | 4537 (11%) | 11637 (11%) | |
30-39 Yrs | 588 (11%) | 5072 (12%) | 12182 (12%) | |
40-49 Yrs | 691 (13%) | 5228 (12%) | 13471 (13%) | |
50-59 Yrs | 842 (16%) | 7053 (17%) | 16341 (16%) | |
60-69 Yrs | 507 (9%) | 4304 (10%) | 10065 (10%) | |
70+ Yrs | 481 (9%) | 3977 (9%) | 8057 (8%) | |
Median HH Income | $89,963 | $90,726 | $93,108 | |
Total Household Income | < 24K | 105 (5%) | 1214 (8%) | 2757 (7%) |
25-49K | 277 (15%) | 2381 (16%) | 5082 (14%) | |
50-74K | 333 (18%) | 2373 (16%) | 5663 (16%) | |
75-99K | 308 (17%) | 2262 (15%) | 5543 (15%) | |
100-199K | 619 (34%) | 4929 (33%) | 12071 (34%) | |
200K+ | 157 (8%) | 1624 (10%) | 3918 (11%) | |
Highest Education Level | No Diploma | 243 | 1741 | 3423 |
Diploma or GED | 865 | 6139 | 14546 | |
Some College | 624 | 6254 | 14613 | |
Assoc. Degree | 277 | 2618 | 6374 | |
Bachelors Degree | 767 | 7030 | 17795 | |
Higher Degree | 724 | 4149 | 8955 | |
Total Housing Units | 1,924 | 15,633 | 36,615 | |
--Owner-Occupied | 1,303 | 11,778 | 28,418 | |
--Renter-Occupied | 496 | 3,006 | 6,615 | |
Owner-Occupied Values | < 100K | 2 | 727 | 1420 |
100-199K | 350 | 3565 | 8483 | |
200-299K | 687 | 4570 | 11617 | |
300-399K | 195 | 1945 | 4381 | |
400-499K | 31 | 488 | 1363 | |
500K+ | 38 | 482 | 1153 | |
Total Working Age Population | 4,086 | 32,416 | 77,330 | |
In Work Force | 2,904 | 23,052 | 55,948 | |
Not In Work Force | 1,182 | 9,363 | 21,381 | |
Workforce Employed | 2,822 | 22,019 | 53,855 | |
Workforce Unemployed | 82 | 1,024 | 2,071 | |
Civlian Workforce | 2,904 | 23,043 | 55,926 | |
Military Workforce | 0 | 9 | 22 | |
Total Households | 1,799 | 14,783 | 35,033 | |
Family Households | 1,429 | 11,343 | 26,590 | |
Non-Family Households | 371 | 3,441 | 8,444 | |
Married Couple | 1,137 | 9,203 | 22,069 | |
Other Family | 291 | 2,140 | 4,521 | |
Married w/Child | 412 | 3,870 | 9,887 | |
Single Male w/Child | 96 | 329 | 671 | |
Single Female w/Child | 94 | 891 | 1,855 |
Population Change Last Two Decades - Plus Projection
2000 | % | 2010 | % | 2020 | % | 2030 | |
---|---|---|---|---|---|---|---|
Illinois | 12,419,293 | +3 | 12,830,632 | +12 | 14,316,487 | +6 | 15,138,849 |
McHenry County | 260,077 | +19 | 308,760 | +32 | 407,931 | +9 | 443,398 |
Total Working Age Population:
Total Households:
Total Working Age Population:
Total Households:
Total Working Age Population:
Total Households: