Retail Space
226 Laurel Street Baton Rouge, LA 70801
226 Laurel Street Baton Rouge, LA 70801

Details & Description
Property Highlights
- • Off street parking
- • Lot measures 1,928sf -
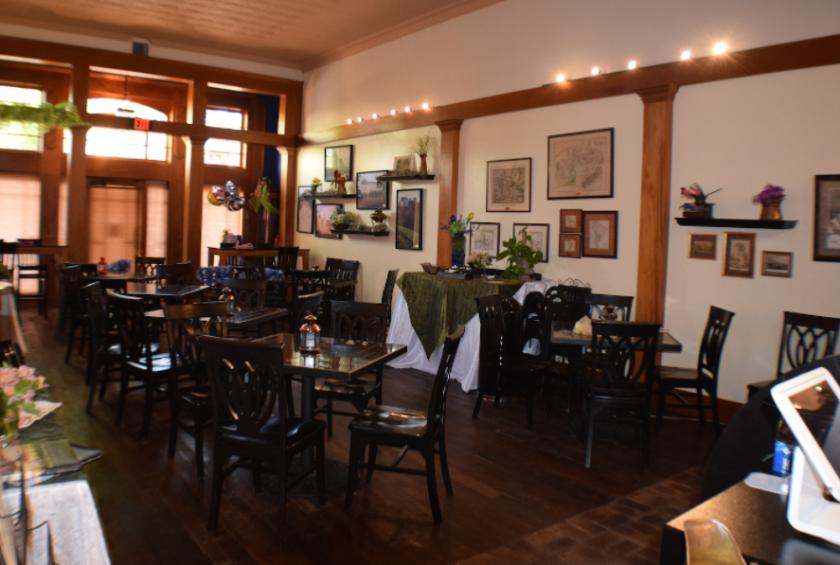
- • Superior interior finishes
- • Space measures 1,240sf -
Listing Agents

David Vercher
KW Commercial
O: 225-405-3257
yourccim@kw.com
KW Commercial
O: 225-405-3257
yourccim@kw.com
While we strive to provide the most accurate information, all listing information, and demographic data, is provided by third-parties. As such, MyEListing will not be responsible for the accuracy of the information. It is strongly recommended that you verify all information with the listing agent, and any relevant agencies, prior to making any decisions.