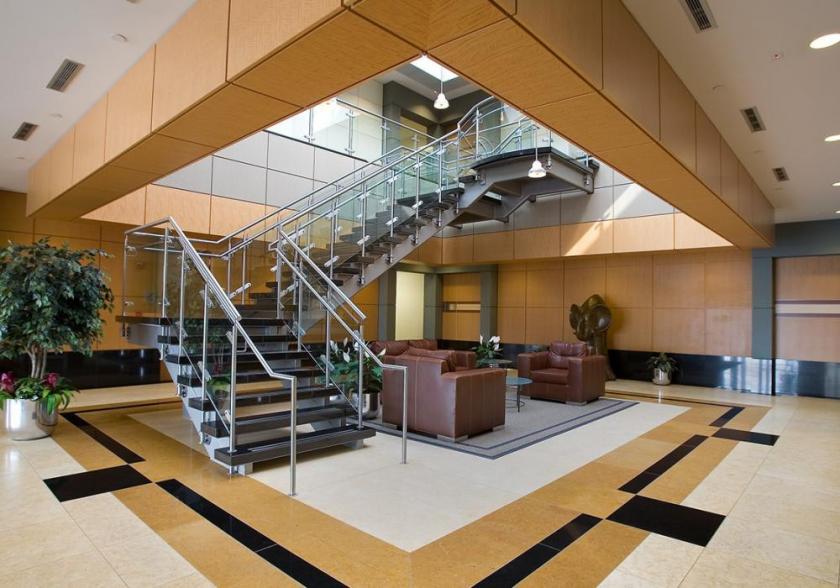
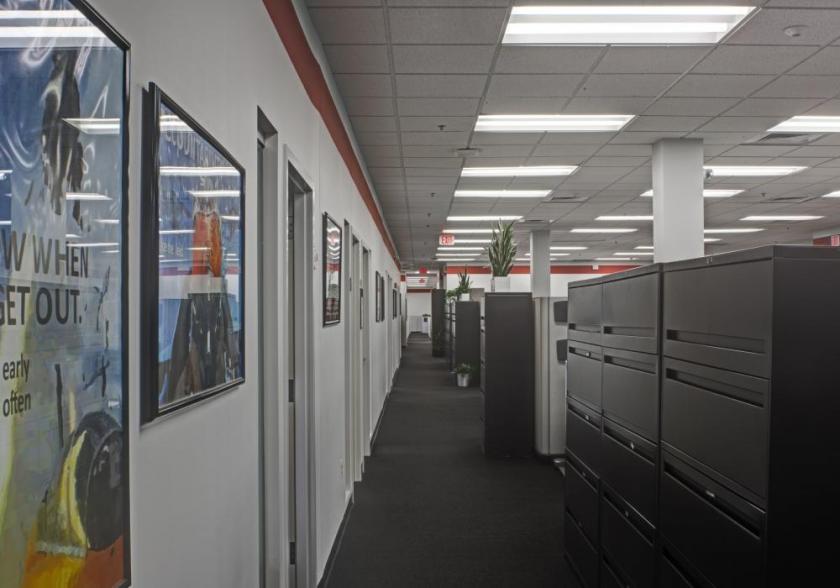
Flex-Office-Warehouse
20110 Ashbrook Place Ashburn, VA 20147
20110 Ashbrook Place Ashburn, VA 20147
Details & Description
Property Highlights
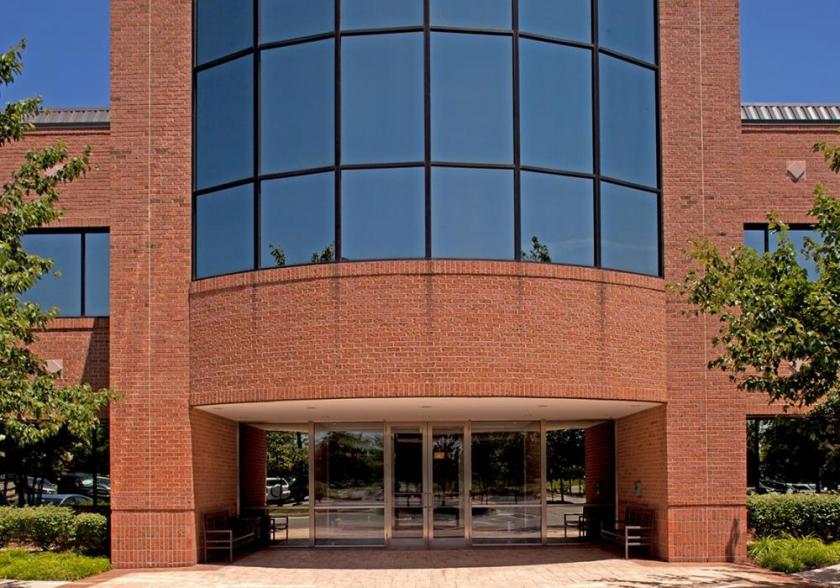
- • Brick facade with continuous ribbon glass
- • Parking ratios up to 4.41,000
- • FiOS service available
- • 120208 volt, 3-phase, 4-wire service
- • Sprinklered
- • Minutes from Dulles International Airport
Listing Agents

Shaelyn Mullaney
O: 919-526-0070
smullaney@merrittproperties.com
O: 919-526-0070
smullaney@merrittproperties.com
While we strive to provide the most accurate information, all listing information, and demographic data, is provided by third-parties. As such, MyEListing will not be responsible for the accuracy of the information. It is strongly recommended that you verify all information with the listing agent, and any relevant agencies, prior to making any decisions.