Multifamily Housing
4302 Decoursey Avenue Covington, KY 41015
4302 Decoursey Avenue Covington, KY 41015

Details & Description
Property Highlights
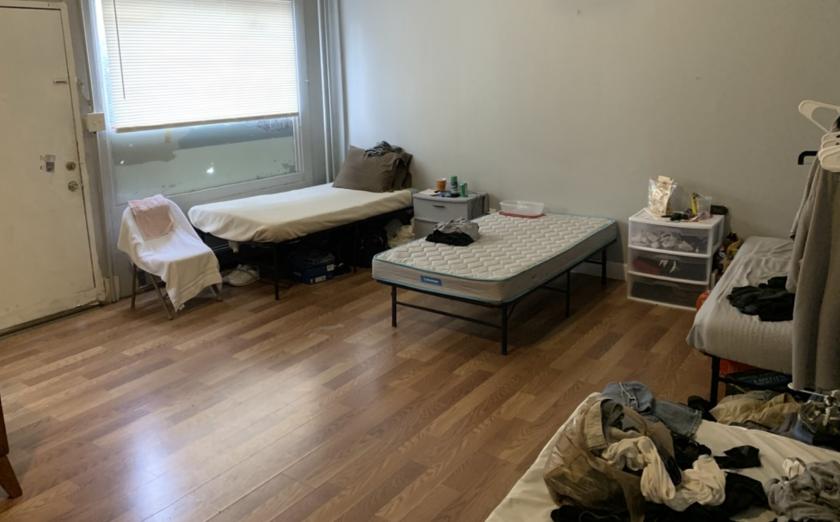
• Second Floor - One 2 bed1 bath - One 1 bed1bath
• Main Floor - One Studio - Two 1 bed1 bath
Listing Agents

T.J. Schutte Jr.
KW Commercial
O: 859-359-6805
M: 859-468-6799
tjschuttejr@kw.com
KW Commercial
O: 859-359-6805
M: 859-468-6799
tjschuttejr@kw.com
While we strive to provide the most accurate information, all listing information, and demographic data, is provided by third-parties. As such, MyEListing will not be responsible for the accuracy of the information. It is strongly recommended that you verify all information with the listing agent, and any relevant agencies, prior to making any decisions.