Flex-Office-Warehouse
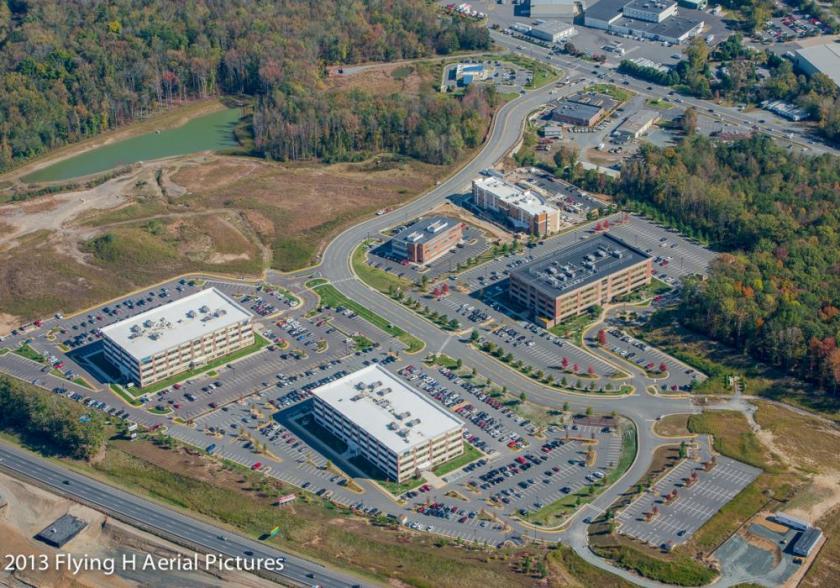
600 Corporate Drive Stafford, VA 22554
600 Corporate Drive Stafford, VA 22554

Details & Description
Property Highlights
- • Delivering Summer 2021
- • Two, single-story light industrial buildings
- • Directly adjacent to Marine Corps Base Quantico
- • Certified HUBZone location
Listing Agents

Shaelyn Mullaney
O: 919-526-0070
smullaney@merrittproperties.com
O: 919-526-0070
smullaney@merrittproperties.com
While we strive to provide the most accurate information, all listing information, and demographic data, is provided by third-parties. As such, MyEListing will not be responsible for the accuracy of the information. It is strongly recommended that you verify all information with the listing agent, and any relevant agencies, prior to making any decisions.