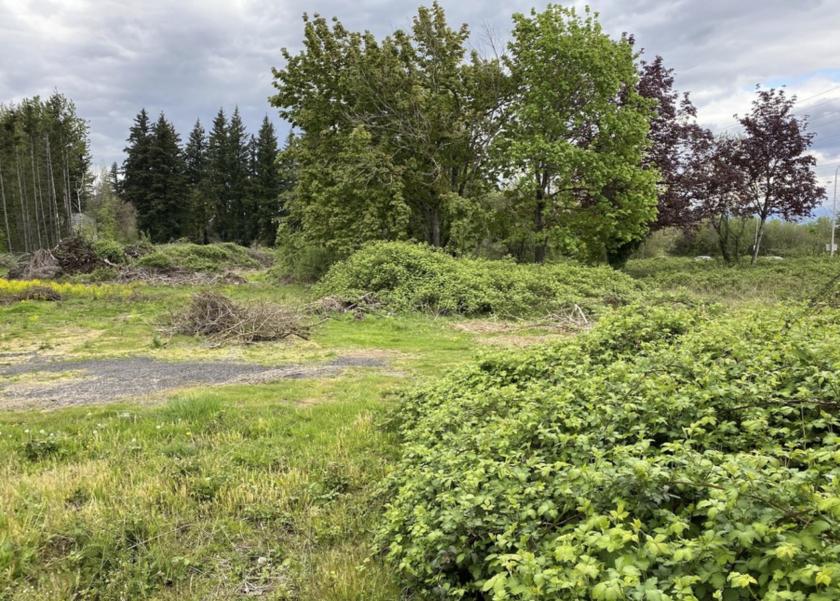
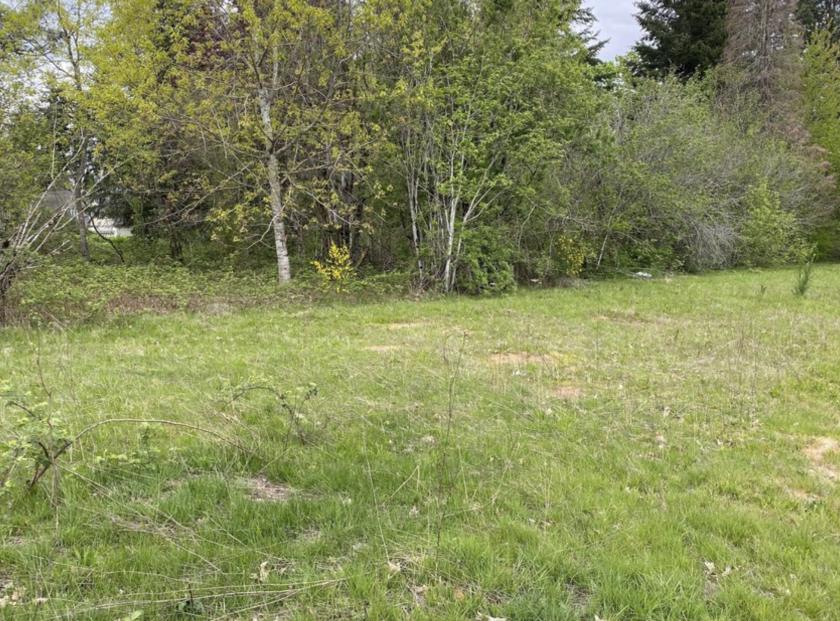
1-Mile | 3-Miles | 5-Miles | ||
---|---|---|---|---|
Total Population | 11,161 | 106,550 | 255,643 | |
Population Median Age | 36 | 37 | 38 | |
Population by Age | 0-9 Yrs | 1527 (13%) | 14876 (13%) | 34150 (13%) |
10-19 Yrs | 1468 (13%) | 13358 (12%) | 32457 (12%) | |
20-29 Yrs | 1612 (14%) | 15105 (14%) | 34212 (13%) | |
30-39 Yrs | 1870 (16%) | 16481 (15%) | 38318 (14%) | |
40-49 Yrs | 1610 (14%) | 13189 (12%) | 33902 (13%) | |
50-59 Yrs | 1359 (12%) | 13045 (12%) | 32630 (12%) | |
60-69 Yrs | 1015 (9%) | 11119 (10%) | 27543 (10%) | |
70+ Yrs | 700 (6%) | 9377 (8%) | 22431 (8%) | |
Median HH Income | $55,013 | $51,708 | $58,795 | |
Total Household Income | < 24K | 596 (14%) | 8556 (21%) | 17601 (19%) |
25-49K | 1151 (28%) | 10434 (26%) | 21312 (23%) | |
50-74K | 1052 (25%) | 7694 (19%) | 17145 (18%) | |
75-99K | 589 (14%) | 5050 (12%) | 12122 (13%) | |
100-199K | 653 (15%) | 6637 (16%) | 19732 (21%) | |
200K+ | 55 (1%) | 878 (2%) | 3841 (4%) | |
Highest Education Level | No Diploma | 1300 | 11342 | 24401 |
Diploma or GED | 1992 | 19577 | 44229 | |
Some College | 2273 | 20005 | 46058 | |
Assoc. Degree | 671 | 6592 | 16355 | |
Bachelors Degree | 868 | 9696 | 27890 | |
Higher Degree | 341 | 4417 | 14805 | |
Total Housing Units | 4,354 | 41,791 | 97,357 | |
--Owner-Occupied | 2,189 | 20,630 | 53,870 | |
--Renter-Occupied | 1,906 | 18,618 | 37,882 | |
Owner-Occupied Values | < 100K | 450 | 2174 | 3906 |
100-199K | 172 | 2934 | 5960 | |
200-299K | 894 | 7697 | 17512 | |
300-399K | 573 | 5977 | 16669 | |
400-499K | 88 | 1255 | 5868 | |
500K+ | 12 | 593 | 3956 | |
Total Working Age Population | 8,704 | 83,084 | 200,763 | |
In Work Force | 5,966 | 54,160 | 130,619 | |
Not In Work Force | 2,738 | 28,924 | 70,144 | |
Workforce Employed | 5,678 | 50,787 | 123,063 | |
Workforce Unemployed | 288 | 3,358 | 7,383 | |
Civlian Workforce | 5,966 | 54,145 | 130,446 | |
Military Workforce | 0 | 15 | 173 | |
Total Households | 4,096 | 39,248 | 91,752 | |
Family Households | 2,597 | 25,057 | 61,282 | |
Non-Family Households | 1,499 | 14,191 | 30,469 | |
Married Couple | 1,800 | 16,527 | 43,092 | |
Other Family | 797 | 8,530 | 18,190 | |
Married w/Child | 865 | 7,177 | 18,557 | |
Single Male w/Child | 182 | 1,217 | 2,655 | |
Single Female w/Child | 234 | 3,445 | 7,300 |
Population Change Last Two Decades - Plus Projection
2000 | % | 2010 | % | 2020 | % | 2030 | |
---|---|---|---|---|---|---|---|
Oregon | 3,421,399 | +12 | 3,831,074 | +11 | 4,264,810 | +11 | 4,727,438 |
Clackamas County | 338,391 | +11 | 375,992 | +14 | 428,860 | +14 | 490,011 |
Multnomah County | 660,486 | +11 | 735,334 | +12 | 822,675 | +10 | 906,904 |
Washington | 5,894,121 | +14 | 6,724,540 | +14 | 7,638,415 | +11 | 8,503,178 |
Clark County | 345,238 | +23 | 425,363 | +17 | 499,400 | +16 | 576,879 |
Total Working Age Population:
Total Households:
Total Working Age Population:
Total Households:
Total Working Age Population:
Total Households: