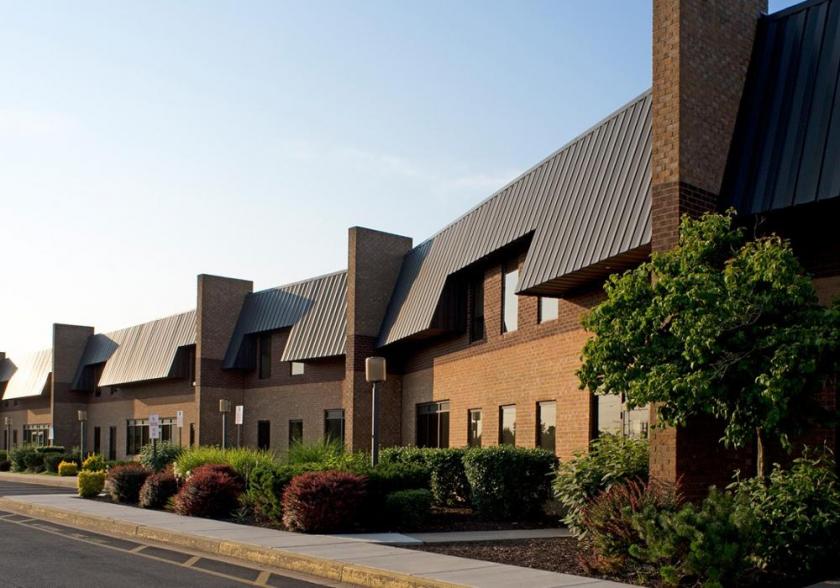
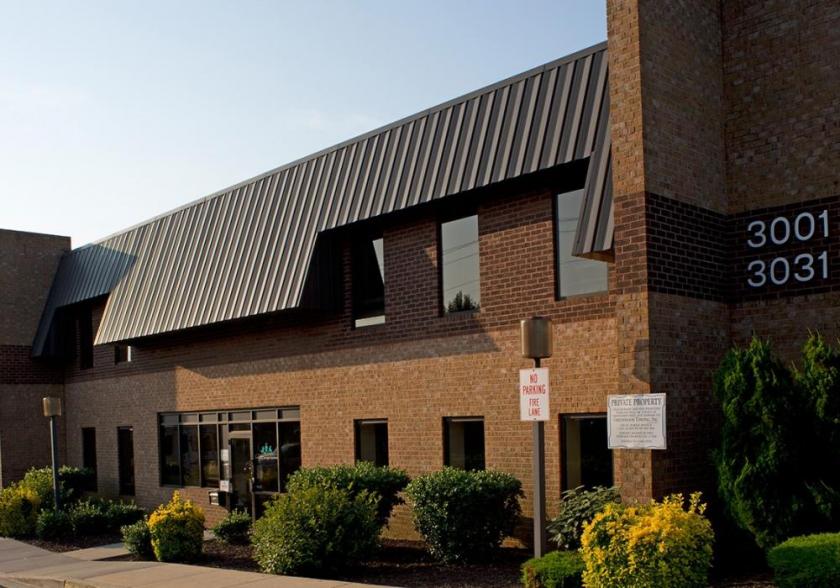
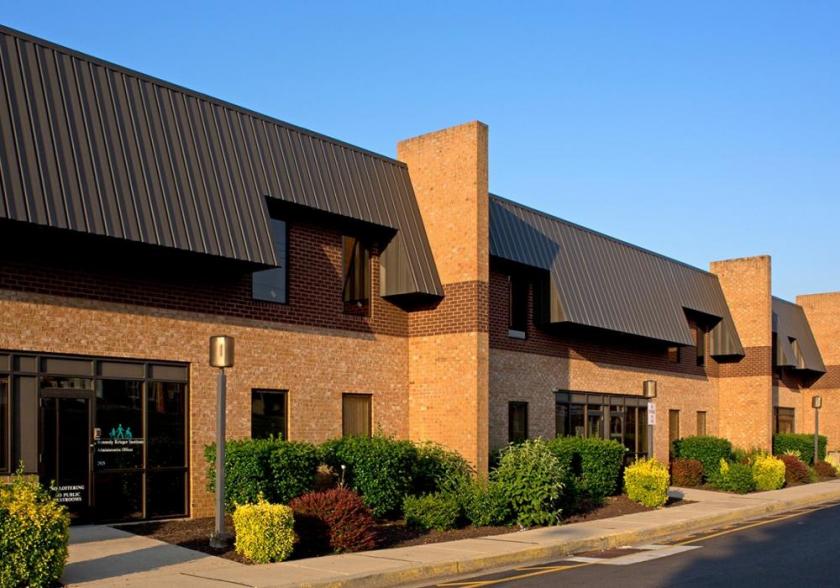
1-Mile | 3-Miles | 5-Miles | ||
---|---|---|---|---|
Total Population | 35,473 | 263,617 | 540,110 | |
Population Median Age | 35 | 37 | 37 | |
Population by Age | 0-9 Yrs | 5654 (15%) | 29956 (11%) | 64906 (12%) |
10-19 Yrs | 4456 (12%) | 27143 (10%) | 59059 (10%) | |
20-29 Yrs | 5078 (14%) | 53048 (20%) | 95606 (17%) | |
30-39 Yrs | 6226 (17%) | 49230 (18%) | 90564 (16%) | |
40-49 Yrs | 3996 (11%) | 28844 (10%) | 59796 (11%) | |
50-59 Yrs | 4417 (12%) | 31051 (11%) | 68903 (12%) | |
60-69 Yrs | 3286 (9%) | 25673 (9%) | 57473 (10%) | |
70+ Yrs | 2360 (6%) | 18671 (7%) | 43804 (8%) | |
Median HH Income | $41,676 | $57,157 | $54,560 | |
Total Household Income | < 24K | 4026 (32%) | 27053 (25%) | 54243 (25%) |
25-49K | 3023 (24%) | 21582 (20%) | 45091 (21%) | |
50-74K | 1901 (15%) | 16669 (15%) | 34400 (16%) | |
75-99K | 1093 (8%) | 11623 (10%) | 23964 (11%) | |
100-199K | 1814 (14%) | 21390 (19%) | 40682 (19%) | |
200K+ | 392 (3%) | 9319 (8%) | 14933 (7%) | |
Highest Education Level | No Diploma | 5057 | 26059 | 53777 |
Diploma or GED | 8362 | 46537 | 108669 | |
Some College | 4209 | 30577 | 68988 | |
Assoc. Degree | 966 | 7544 | 18057 | |
Bachelors Degree | 2425 | 39619 | 68039 | |
Higher Degree | 2119 | 36252 | 60424 | |
Total Housing Units | 16,957 | 129,593 | 259,497 | |
--Owner-Occupied | 5,597 | 48,793 | 104,494 | |
--Renter-Occupied | 6,651 | 58,843 | 108,820 | |
Owner-Occupied Values | < 100K | 2641 | 9960 | 20784 |
100-199K | 1661 | 16098 | 40705 | |
200-299K | 860 | 9818 | 22503 | |
300-399K | 217 | 5479 | 8732 | |
400-499K | 43 | 2873 | 4391 | |
500K+ | 176 | 4565 | 7379 | |
Total Working Age Population | 27,136 | 218,156 | 441,685 | |
In Work Force | 16,171 | 142,597 | 281,534 | |
Not In Work Force | 10,965 | 75,559 | 160,152 | |
Workforce Employed | 14,197 | 132,758 | 260,460 | |
Workforce Unemployed | 1,926 | 9,310 | 20,350 | |
Civlian Workforce | 16,123 | 142,068 | 280,810 | |
Military Workforce | 48 | 529 | 724 | |
Total Households | 12,248 | 107,636 | 213,314 | |
Family Households | 6,944 | 48,648 | 107,242 | |
Non-Family Households | 5,304 | 58,988 | 106,072 | |
Married Couple | 2,407 | 25,420 | 56,207 | |
Other Family | 4,537 | 23,228 | 51,034 | |
Married w/Child | 896 | 8,477 | 19,447 | |
Single Male w/Child | 403 | 1,992 | 4,674 | |
Single Female w/Child | 1,666 | 9,056 | 19,565 |
Population Change Last Two Decades - Plus Projection
2000 | % | 2010 | % | 2020 | % | 2030 | |
---|---|---|---|---|---|---|---|
Maryland | 5,296,486 | +9 | 5,773,552 | +6 | 6,141,900 | +6 | 6,518,750 |
Anne Arundel County | 489,656 | +10 | 537,656 | +7 | 573,250 | +4 | 596,700 |
Baltimore County | 754,292 | +7 | 805,029 | +5 | 847,000 | +2 | 862,200 |
Harford County | 218,590 | +12 | 244,826 | +5 | 257,700 | +5 | 271,850 |
Baltimore city | 651,154 | -5 | 620,961 | -1 | 616,300 | +1 | 625,100 |
Total Working Age Population:
Total Households:
Total Working Age Population:
Total Households:
Total Working Age Population:
Total Households: