Retail Space
3533 East Chapman Avenue Orange, CA 92869
3533 East Chapman Avenue Orange, CA 92869
Details & Description
Property Highlights
- • Beer Wine License
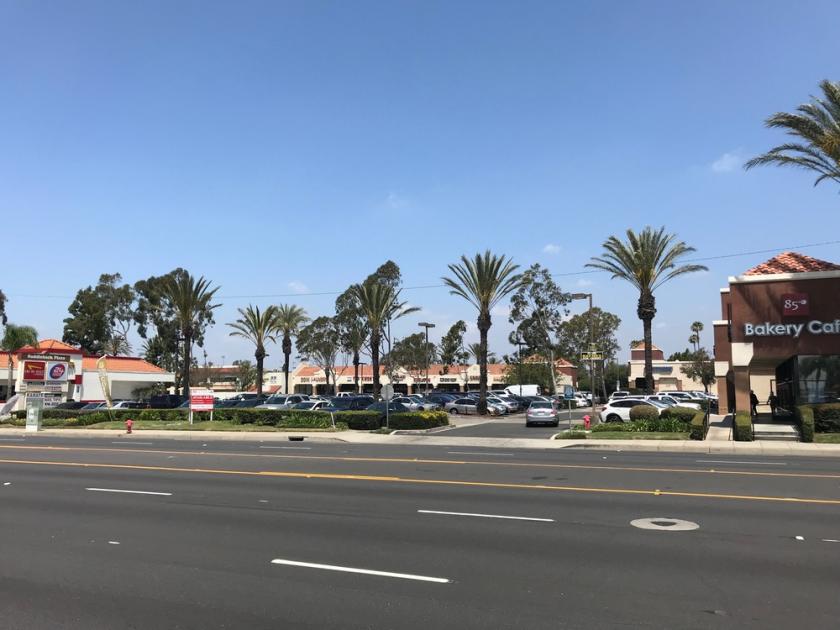
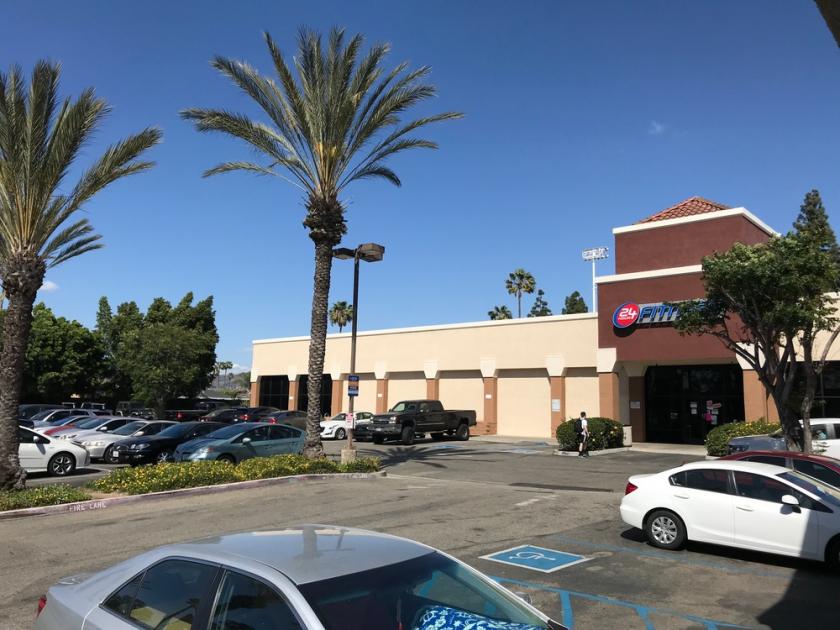
- • Heavy Impacted Plaza
- • Adjacent to Fred Kelly Stadium
- • Ample Parking
- • High Traffic Counts from Chapman Avenue
Listing Agents

Tom Gonzalez
KW Commercial
O: 714-441-8721
M: 714-726-3007
tomgonzalez.re@gmail.com
KW Commercial
O: 714-441-8721
M: 714-726-3007
tomgonzalez.re@gmail.com
While we strive to provide the most accurate information, all listing information, and demographic data, is provided by third-parties. As such, MyEListing will not be responsible for the accuracy of the information. It is strongly recommended that you verify all information with the listing agent, and any relevant agencies, prior to making any decisions.