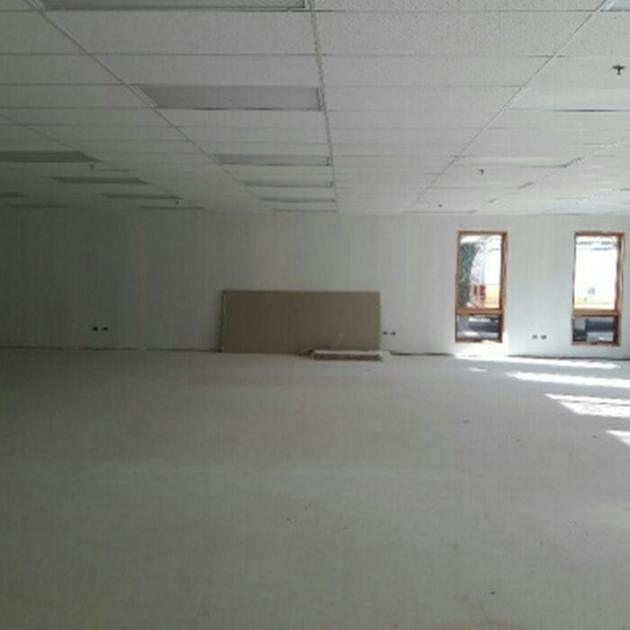
Office Space
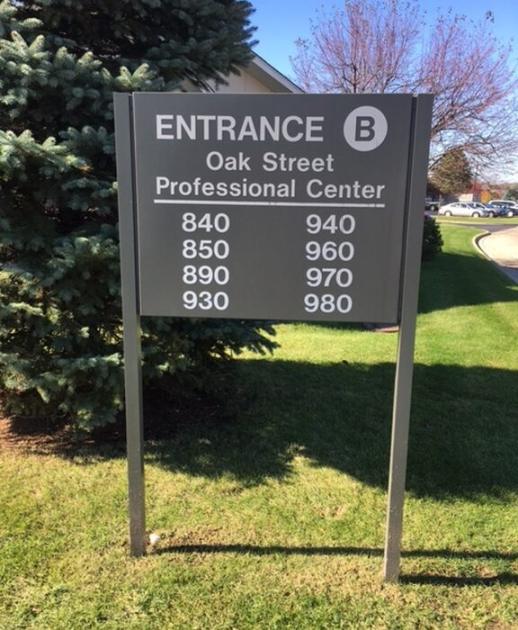
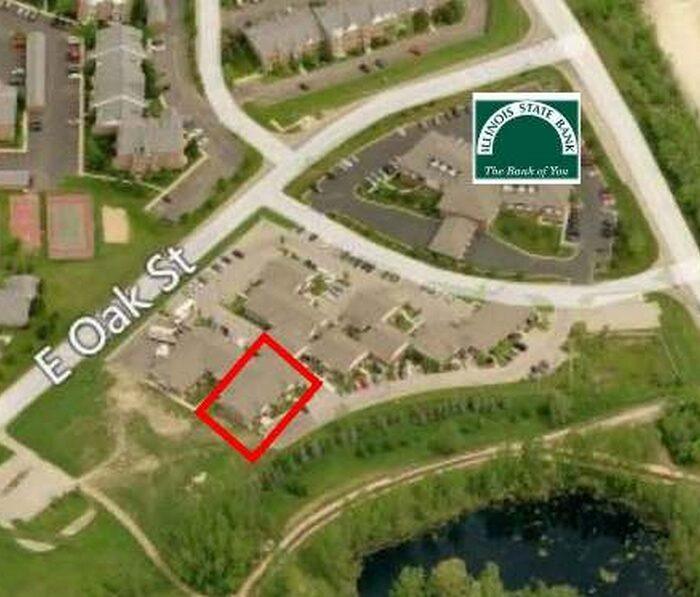
850 East Oak Street Lake In The Hills, IL 60156
850 East Oak Street Lake In The Hills, IL 60156
Details & Description
Property Highlights
- • Year Built 2003
- • HVAC System Buyer’s Build Out
- • Electrical to Space
- • Sprinkled Dry System
- • Washrooms Buyer’s Build Out
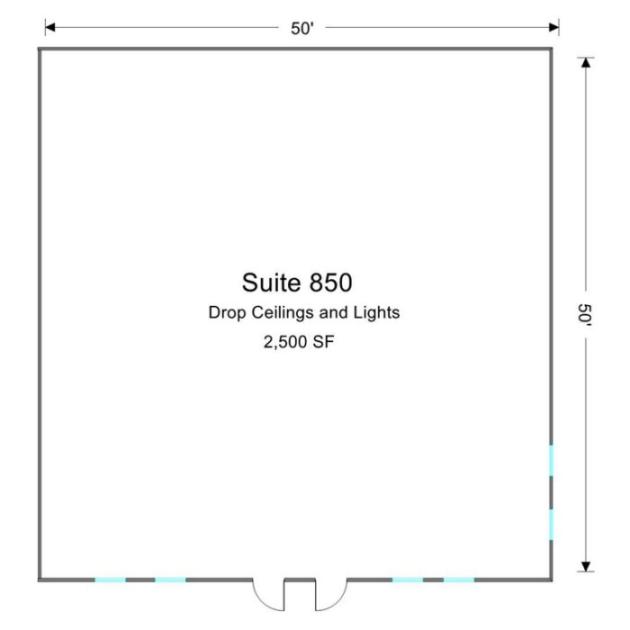
- • Ceiling Height 9’
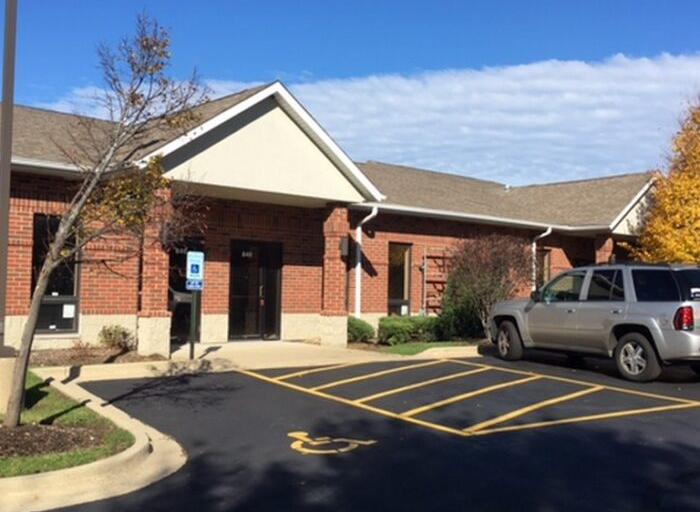
Additional Photos


Listing Agents

Heather Schweitzer
O: 847-854-2300
M: 815-236-9816
heathers@premiercommercialrealty.com
O: 847-854-2300
M: 815-236-9816
heathers@premiercommercialrealty.com
While we strive to provide the most accurate information, all listing information, and demographic data, is provided by third-parties. As such, MyEListing will not be responsible for the accuracy of the information. It is strongly recommended that you verify all information with the listing agent, and any relevant agencies, prior to making any decisions.