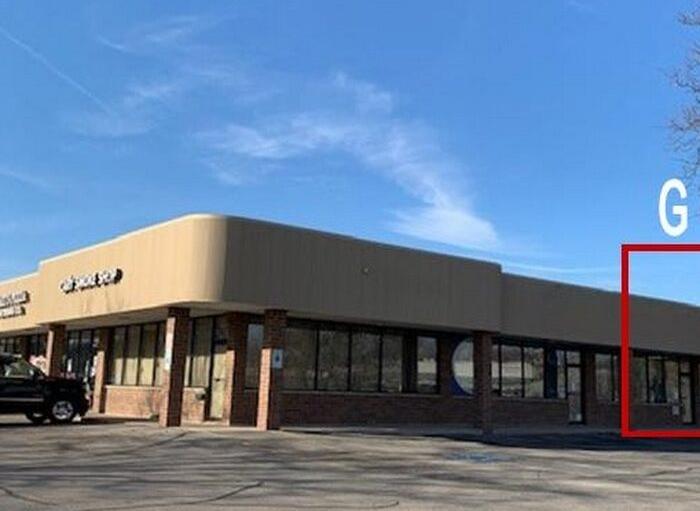
Retail Space
395 Cary Algonquin Road Cary, IL 60013
395 Cary Algonquin Road Cary, IL 60013
Details & Description
Property Highlights
- • Year Built 1986
- • HVAC System GFA / Central Air
- • Electrical 100 AMP
- • Sprinklers No
- • Washrooms 1 per unit
- • Ceiling Height 10’
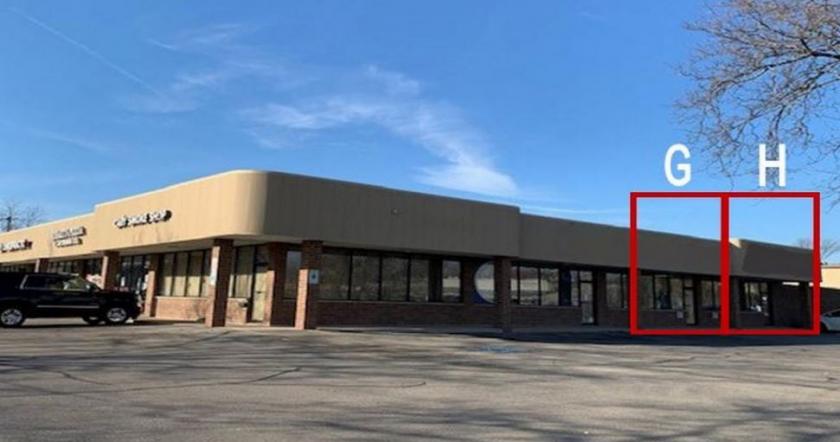
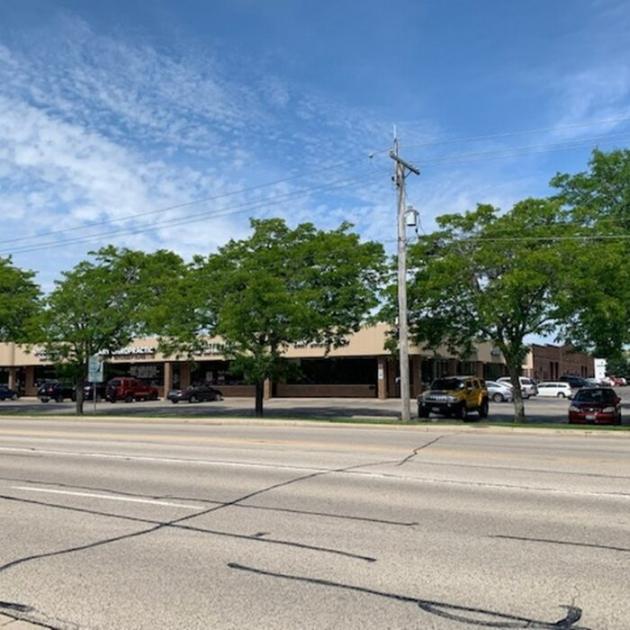
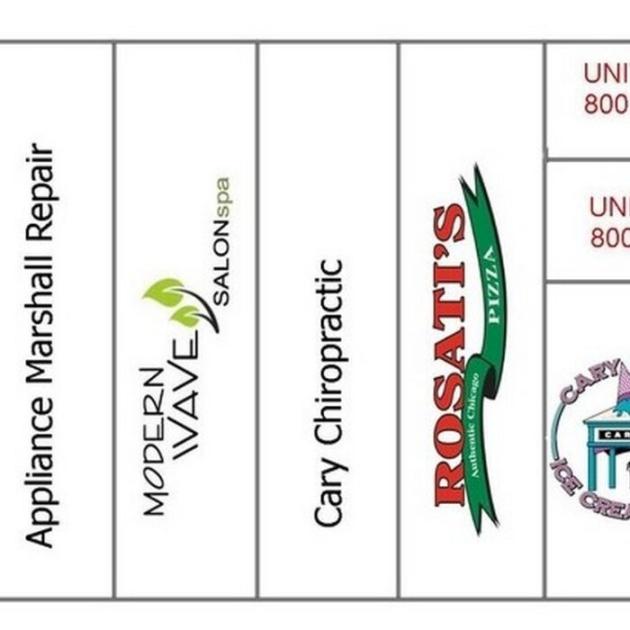
Additional Photos
Listing Agents

Heather Schweitzer
O: 847-854-2300
M: 815-236-9816
heathers@premiercommercialrealty.com
O: 847-854-2300
M: 815-236-9816
heathers@premiercommercialrealty.com
While we strive to provide the most accurate information, all listing information, and demographic data, is provided by third-parties. As such, MyEListing will not be responsible for the accuracy of the information. It is strongly recommended that you verify all information with the listing agent, and any relevant agencies, prior to making any decisions.


