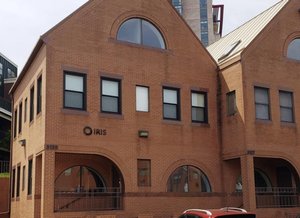
1-Mile | 3-Miles | 5-Miles | ||
---|---|---|---|---|
Total Population | 17,939 | 146,621 | 388,705 | |
Population Median Age | 37 | 37 | 38 | |
Population by Age | 0-9 Yrs | 2414 (13%) | 19937 (13%) | 51189 (13%) |
10-19 Yrs | 1628 (9%) | 16447 (11%) | 41220 (10%) | |
20-29 Yrs | 2468 (13%) | 19233 (13%) | 50405 (12%) | |
30-39 Yrs | 3434 (19%) | 26899 (18%) | 70589 (18%) | |
40-49 Yrs | 2433 (13%) | 20284 (13%) | 54300 (13%) | |
50-59 Yrs | 2793 (15%) | 19634 (13%) | 50000 (12%) | |
60-69 Yrs | 1633 (9%) | 14220 (9%) | 38304 (9%) | |
70+ Yrs | 1136 (6%) | 9967 (6%) | 32700 (8%) | |
Median HH Income | $131,212 | $103,526 | $102,069 | |
Total Household Income | < 24K | 379 (5%) | 4177 (7%) | 12735 (8%) |
25-49K | 512 (7%) | 6575 (12%) | 18437 (12%) | |
50-74K | 684 (9%) | 6753 (12%) | 20542 (14%) | |
75-99K | 857 (12%) | 7749 (14%) | 19947 (13%) | |
100-199K | 2922 (42%) | 18677 (35%) | 49306 (33%) | |
200K+ | 1509 (21%) | 8303 (15%) | 25136 (17%) | |
Highest Education Level | No Diploma | 1066 | 11108 | 26105 |
Diploma or GED | 2036 | 17087 | 42729 | |
Some College | 1848 | 16158 | 40900 | |
Assoc. Degree | 841 | 7180 | 18086 | |
Bachelors Degree | 3617 | 27085 | 74544 | |
Higher Degree | 3603 | 23193 | 72318 | |
Total Housing Units | 7,034 | 54,923 | 155,043 | |
--Owner-Occupied | 4,870 | 31,527 | 82,321 | |
--Renter-Occupied | 1,994 | 20,708 | 63,783 | |
Owner-Occupied Values | < 100K | 104 | 845 | 1791 |
100-199K | 195 | 1974 | 4202 | |
200-299K | 402 | 3348 | 8155 | |
300-399K | 808 | 6157 | 13747 | |
400-499K | 1356 | 8285 | 18727 | |
500K+ | 2005 | 10917 | 35699 | |
Total Working Age Population | 14,356 | 116,274 | 311,380 | |
In Work Force | 11,030 | 87,306 | 230,091 | |
Not In Work Force | 3,327 | 28,968 | 81,289 | |
Workforce Employed | 10,307 | 80,649 | 214,020 | |
Workforce Unemployed | 385 | 3,621 | 8,783 | |
Civlian Workforce | 10,692 | 84,271 | 222,803 | |
Military Workforce | 337 | 3,035 | 7,288 | |
Total Households | 6,863 | 52,235 | 146,104 | |
Family Households | 4,362 | 33,840 | 89,626 | |
Non-Family Households | 2,501 | 18,395 | 56,477 | |
Married Couple | 3,362 | 25,042 | 67,491 | |
Other Family | 1,000 | 8,797 | 22,135 | |
Married w/Child | 1,490 | 11,766 | 31,281 | |
Single Male w/Child | 111 | 1,063 | 2,279 | |
Single Female w/Child | 461 | 3,148 | 8,250 |
Population Change Last Two Decades - Plus Projection
2000 | % | 2010 | % | 2020 | % | 2030 | |
---|---|---|---|---|---|---|---|
District of Columbia | 572,059 | +5 | 601,723 | +21 | 729,501 | +15 | 842,154 |
Maryland | 5,296,486 | +9 | 5,773,552 | +6 | 6,141,900 | +6 | 6,518,750 |
Charles County | 120,546 | +22 | 146,551 | +14 | 167,050 | +17 | 194,650 |
Prince Georges County | 801,515 | +8 | 863,420 | +6 | 916,150 | +4 | 952,950 |
Virginia | 7,078,515 | +13 | 8,001,024 | +8 | 8,655,021 | +8 | 9,331,666 |
Arlington County | 189,453 | +10 | 207,627 | +20 | 249,298 | +10 | 274,339 |
Fairfax County | 969,749 | +12 | 1,081,726 | +7 | 1,162,504 | +7 | 1,244,025 |
Prince William County | 280,813 | +43 | 402,002 | +19 | 478,134 | +20 | 571,844 |
Alexandria city | 128,283 | +9 | 139,966 | +19 | 166,261 | +10 | 182,067 |
Total Working Age Population:
Total Households:
Total Working Age Population:
Total Households:
Total Working Age Population:
Total Households: