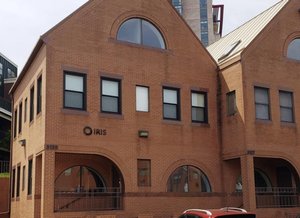
1-Mile | 3-Miles | 5-Miles | ||
---|---|---|---|---|
Total Population | 15,829 | 110,260 | 266,353 | |
Population Median Age | 38 | 38 | 39 | |
Population by Age | 0-9 Yrs | 1986 (12%) | 13852 (12%) | 33762 (12%) |
10-19 Yrs | 1377 (8%) | 13081 (11%) | 32933 (12%) | |
20-29 Yrs | 2526 (15%) | 14565 (13%) | 31477 (11%) | |
30-39 Yrs | 3307 (20%) | 17040 (15%) | 38013 (14%) | |
40-49 Yrs | 2021 (12%) | 16102 (14%) | 38969 (14%) | |
50-59 Yrs | 1767 (11%) | 14534 (13%) | 36266 (13%) | |
60-69 Yrs | 1469 (9%) | 11074 (10%) | 28995 (10%) | |
70+ Yrs | 1378 (8%) | 10012 (9%) | 25939 (9%) | |
Median HH Income | $119,664 | $139,652 | $142,170 | |
Total Household Income | < 24K | 513 (7%) | 2917 (6%) | 6704 (6%) |
25-49K | 486 (7%) | 3125 (7%) | 7432 (7%) | |
50-74K | 844 (12%) | 4003 (9%) | 8979 (9%) | |
75-99K | 945 (14%) | 4847 (11%) | 10394 (10%) | |
100-199K | 2327 (34%) | 13301 (31%) | 31481 (32%) | |
200K+ | 1586 (23%) | 13502 (32%) | 32402 (33%) | |
Highest Education Level | No Diploma | 330 | 3342 | 10214 |
Diploma or GED | 701 | 5892 | 16316 | |
Some College | 1056 | 6699 | 17876 | |
Assoc. Degree | 610 | 3390 | 7859 | |
Bachelors Degree | 4018 | 25390 | 59399 | |
Higher Degree | 4618 | 32267 | 73512 | |
Total Housing Units | 7,182 | 44,241 | 102,700 | |
--Owner-Occupied | 2,806 | 25,334 | 65,322 | |
--Renter-Occupied | 3,894 | 16,361 | 32,070 | |
Owner-Occupied Values | < 100K | 7 | 180 | 473 |
100-199K | 53 | 444 | 1117 | |
200-299K | 291 | 1220 | 2731 | |
300-399K | 291 | 1297 | 3500 | |
400-499K | 252 | 1873 | 6165 | |
500K+ | 1912 | 20320 | 51337 | |
Total Working Age Population | 12,995 | 88,083 | 211,722 | |
In Work Force | 9,389 | 63,356 | 149,875 | |
Not In Work Force | 3,605 | 24,727 | 61,847 | |
Workforce Employed | 8,943 | 60,980 | 144,031 | |
Workforce Unemployed | 404 | 1,960 | 4,688 | |
Civlian Workforce | 9,346 | 62,940 | 148,719 | |
Military Workforce | 43 | 416 | 1,156 | |
Total Households | 6,700 | 41,696 | 97,392 | |
Family Households | 3,915 | 27,688 | 67,681 | |
Non-Family Households | 2,785 | 14,007 | 29,711 | |
Married Couple | 3,173 | 23,356 | 56,665 | |
Other Family | 742 | 4,332 | 11,015 | |
Married w/Child | 1,615 | 11,543 | 27,161 | |
Single Male w/Child | 132 | 695 | 1,539 | |
Single Female w/Child | 189 | 1,299 | 3,750 |
Population Change Last Two Decades - Plus Projection
2000 | % | 2010 | % | 2020 | % | 2030 | |
---|---|---|---|---|---|---|---|
Maryland | 5,296,486 | +9 | 5,773,552 | +6 | 6,141,900 | +6 | 6,518,750 |
Montgomery County | 873,341 | +11 | 971,777 | +8 | 1,052,050 | +7 | 1,128,800 |
Virginia | 7,078,515 | +13 | 8,001,024 | +8 | 8,655,021 | +8 | 9,331,666 |
Arlington County | 189,453 | +10 | 207,627 | +20 | 249,298 | +10 | 274,339 |
Fairfax County | 969,749 | +12 | 1,081,726 | +7 | 1,162,504 | +7 | 1,244,025 |
Prince William County | 280,813 | +43 | 402,002 | +19 | 478,134 | +20 | 571,844 |
Fairfax city | 21,498 | +5 | 22,565 | +11 | 25,047 | +5 | 26,397 |
Falls Church city | 10,377 | +19 | 12,332 | +22 | 14,988 | +14 | 17,032 |
Total Working Age Population:
Total Households:
Total Working Age Population:
Total Households:
Total Working Age Population:
Total Households: