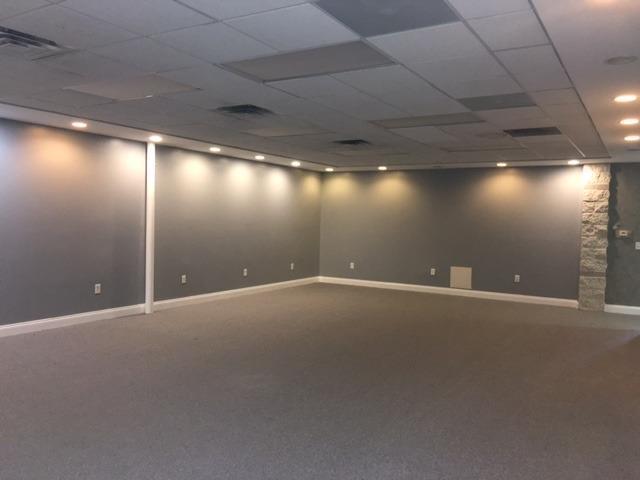
1-Mile | 3-Miles | 5-Miles | ||
---|---|---|---|---|
Total Population | 13,689 | 66,314 | 144,589 | |
Population Median Age | 36 | 37 | 38 | |
Population by Age | 0-9 Yrs | 1940 (14%) | 9562 (14%) | 18973 (13%) |
10-19 Yrs | 1747 (12%) | 8269 (12%) | 18701 (12%) | |
20-29 Yrs | 2306 (16%) | 10135 (15%) | 20331 (14%) | |
30-39 Yrs | 1974 (14%) | 8856 (13%) | 17981 (12%) | |
40-49 Yrs | 1497 (10%) | 7437 (11%) | 18171 (12%) | |
50-59 Yrs | 1929 (14%) | 8873 (13%) | 19107 (13%) | |
60-69 Yrs | 1473 (10%) | 7192 (10%) | 17018 (11%) | |
70+ Yrs | 823 (6%) | 5990 (9%) | 14308 (9%) | |
Median HH Income | $39,607 | $49,183 | $60,724 | |
Total Household Income | < 24K | 1478 (31%) | 6181 (24%) | 10483 (19%) |
25-49K | 1375 (29%) | 6598 (26%) | 12079 (22%) | |
50-74K | 812 (17%) | 5079 (20%) | 10693 (19%) | |
75-99K | 591 (12%) | 3551 (14%) | 8195 (14%) | |
100-199K | 428 (9%) | 3463 (13%) | 11163 (20%) | |
200K+ | 35 (0%) | 264 (1%) | 2128 (3%) | |
Highest Education Level | No Diploma | 1816 | 6065 | 10298 |
Diploma or GED | 4094 | 18104 | 35325 | |
Some College | 1881 | 8766 | 19034 | |
Assoc. Degree | 571 | 3354 | 8028 | |
Bachelors Degree | 418 | 4638 | 15719 | |
Higher Degree | 158 | 2008 | 7071 | |
Total Housing Units | 5,579 | 28,456 | 60,171 | |
--Owner-Occupied | 2,031 | 14,330 | 35,171 | |
--Renter-Occupied | 2,688 | 10,806 | 19,570 | |
Owner-Occupied Values | < 100K | 1724 | 6208 | 9044 |
100-199K | 273 | 6158 | 16133 | |
200-299K | 26 | 1402 | 7290 | |
300-399K | 0 | 421 | 1584 | |
400-499K | 0 | 70 | 575 | |
500K+ | 8 | 71 | 544 | |
Total Working Age Population | 10,721 | 51,407 | 113,823 | |
In Work Force | 6,049 | 31,610 | 73,754 | |
Not In Work Force | 4,672 | 19,798 | 40,069 | |
Workforce Employed | 5,320 | 29,499 | 70,379 | |
Workforce Unemployed | 729 | 2,109 | 3,337 | |
Civlian Workforce | 6,049 | 31,608 | 73,716 | |
Military Workforce | 0 | 2 | 38 | |
Total Households | 4,718 | 25,136 | 54,741 | |
Family Households | 2,862 | 15,663 | 36,341 | |
Non-Family Households | 1,857 | 9,473 | 18,400 | |
Married Couple | 1,600 | 9,963 | 25,844 | |
Other Family | 1,262 | 5,701 | 10,497 | |
Married w/Child | 650 | 3,743 | 10,035 | |
Single Male w/Child | 211 | 877 | 1,556 | |
Single Female w/Child | 502 | 2,446 | 4,038 |
Population Change Last Two Decades - Plus Projection
2000 | % | 2010 | % | 2020 | % | 2030 | |
---|---|---|---|---|---|---|---|
Ohio | 11,353,140 | +2 | 11,536,504 | 0 | 11,574,870 | 0 | 11,615,100 |
Butler County | 332,807 | +11 | 368,130 | +6 | 390,110 | +5 | 410,960 |
Hamilton County | 845,303 | -5 | 802,374 | -1 | 790,600 | -1 | 785,900 |
Total Working Age Population:
Total Households:
Total Working Age Population:
Total Households:
Total Working Age Population:
Total Households: