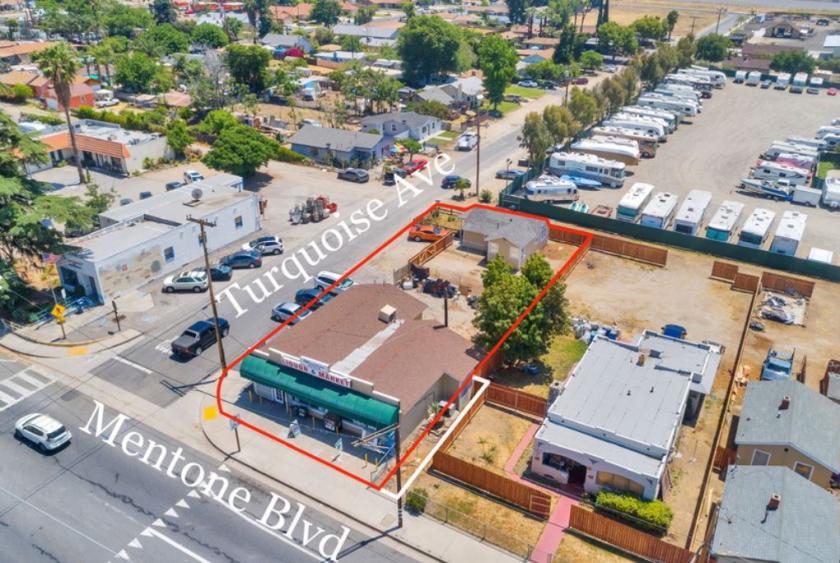
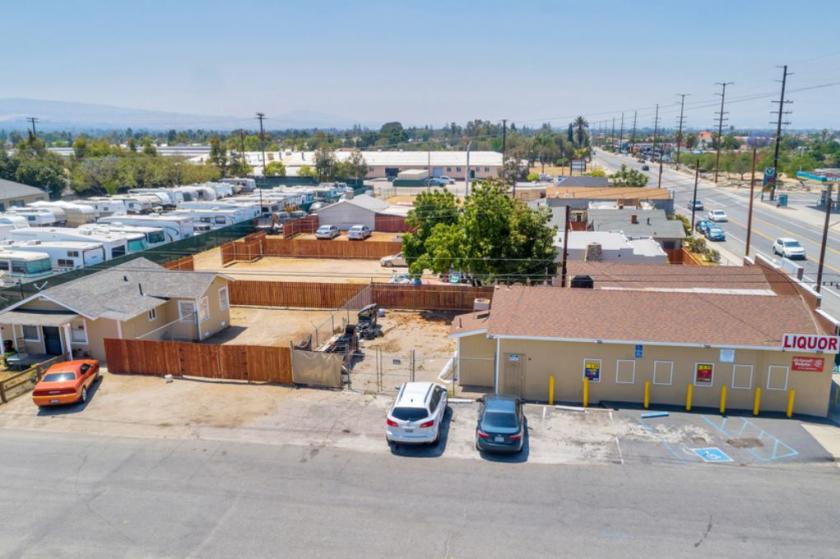
COMMERCIAL CORNER ON HIGHWAY 38 WITH STEADY TRAFFIC COUNT.
*SALE CONSISTS OF A RETAIL BUILDING AND A SFR (SINGE FAMIY RESIDENCE) LOCATED ON MENTONE BLVD, BETWEEN OPAL AND TURQUOISE AVE.
*RETAIL BUILDING APPROXIMATELY 1,707 SQ FT
*SFR ROUGLY 560 SQ FT 2 BEDROOM / 1 BATHROOM.
*PROPERTIES HAVE UNDERGONE REHAB AND UPDATES. NEW FENCING. BOTH UNTIS ARE LEASED WITH ANNUAL INCREASES FOR THE RETAIL STORE. GREAT OPPORTUNITY TO OWN THIS CORNER IN LINE FOR FUTURE DEVELOPMENT.
*RECENTLY OPENED SHOPPING CENTER ANCHORED BY CVS, STATER BROS, AND STARBUCKS LOCATED HALF-MILE AWAY. IN ADDITION, NEWLY CONSTRUCTED DOLLAR GENERAL WITHIN THE TRADE AREA. HIGHWAY 38 ROUTES TO BIG BEAR AND OTHER MOUNTAIN CITIES. BUSINESS ALSO FOR SALE, INQUIRE WITHIN.
**ABANDONED TANKS IN GROUND SINCE 1950s. ABANDONMENT LETTER FROM COUNTY ON FILE.
*CALL FOR MORE INFORMATION AND A TOUR.
No part of this information may be copied, reproduced, repurposed, or screen-captured for any commercial purpose without prior written authorization from MyEListing.
While we strive to provide the most accurate information, all listing information, and demographic data, is provided by third-parties. As such, MyEListing will not be responsible for the accuracy of the information. It is strongly recommended that you verify all information with the listing agent, and any relevant agencies, prior to making any decisions.
What is the asking price for 1840 Mentone Boulevard in Mentone?
The asking price for 1840 Mentone Boulevard is $549,000
What is the building size of this Retail property in Mentone, CA?
The size of the building/unit at 1840 Mentone Boulevard in Mentone is 2,267 square feet
How much land does the Mentone, CA property at 1840 Mentone Boulevard include?
1840 Mentone Boulevard in Mentone includes 0.218 acres of land
What kind of Retail is the propery at 1840 Mentone Boulevard?
The property at 1840 Mentone Boulevard Mentone, CA 92359 is listed as a Free Standing Building Retail property
What is the population within 1 mile of 1840 Mentone Boulevard in Mentone?
The population within 1 mile of 1840 Mentone Boulevard Mentone, CA 92359 is 10,234 people.
Who do I contact for questions about 1840 Mentone Boulevard?
You should contact the listing agent,
T.C. Obichang , for any details regarding this commercial listing.