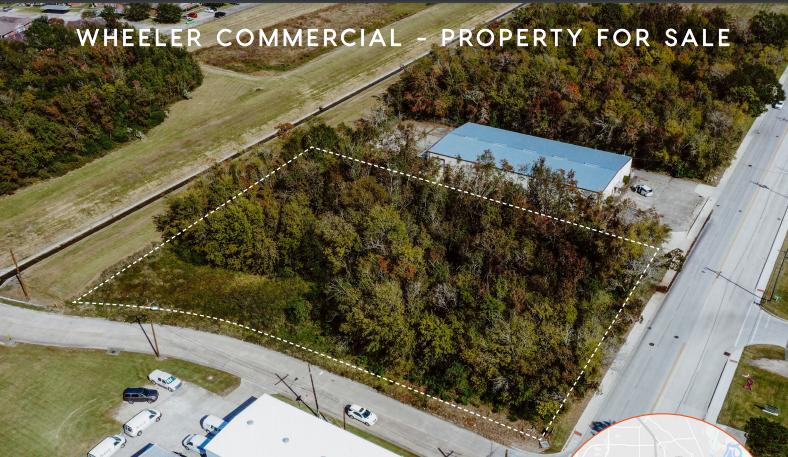
Commercial Land
4050 Washington Boulevard Beaumont, TX 77705
4050 Washington Boulevard Beaumont, TX 77705
Details & Description
Property Highlights
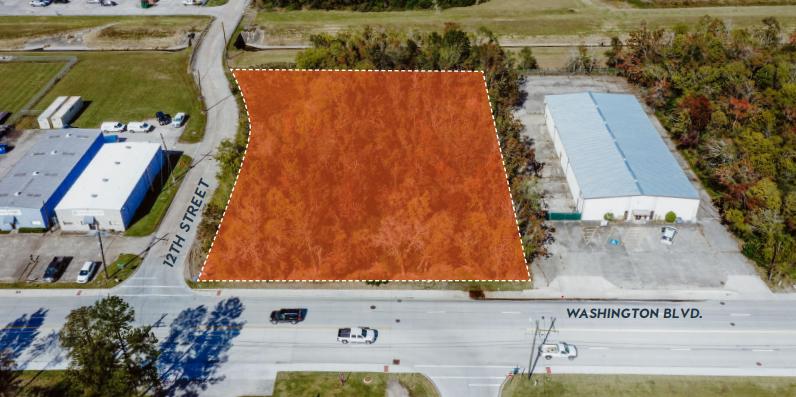
- • Corner of 12th and Washington
- • Highly traveled corridor
- • 190 - of Washington Blvd. Frontage
- • Washington Blvd. currently being redone
- • Great site for development
- • GC-MD zoning - verify with city
Listing Agents

Lee Wheeler
O: 409-899-3300
lwheeler@wheelercommercial.com
O: 409-899-3300
lwheeler@wheelercommercial.com
While we strive to provide the most accurate information, all listing information, and demographic data, is provided by third-parties. As such, MyEListing will not be responsible for the accuracy of the information. It is strongly recommended that you verify all information with the listing agent, and any relevant agencies, prior to making any decisions.