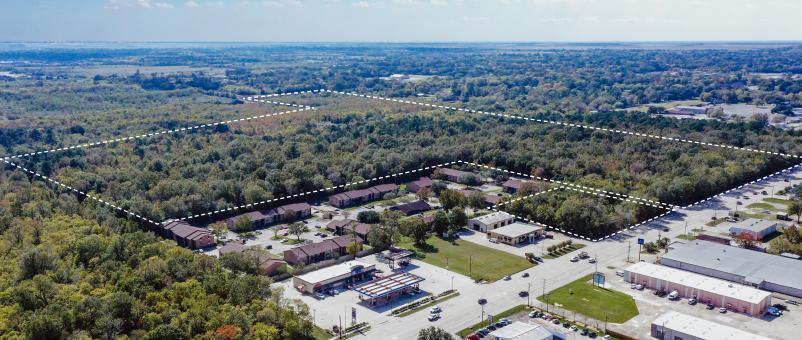
Commercial Land
College and Pinchback Rd Beaumont, TX 77707
College and Pinchback Rd Beaumont, TX 77707
Details & Description
Property Highlights
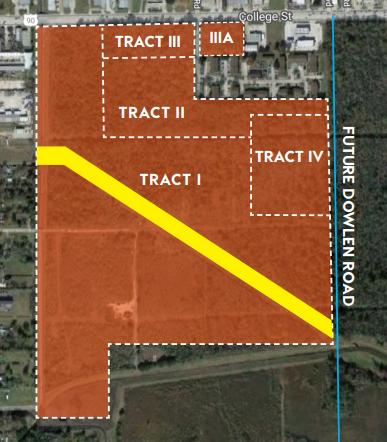
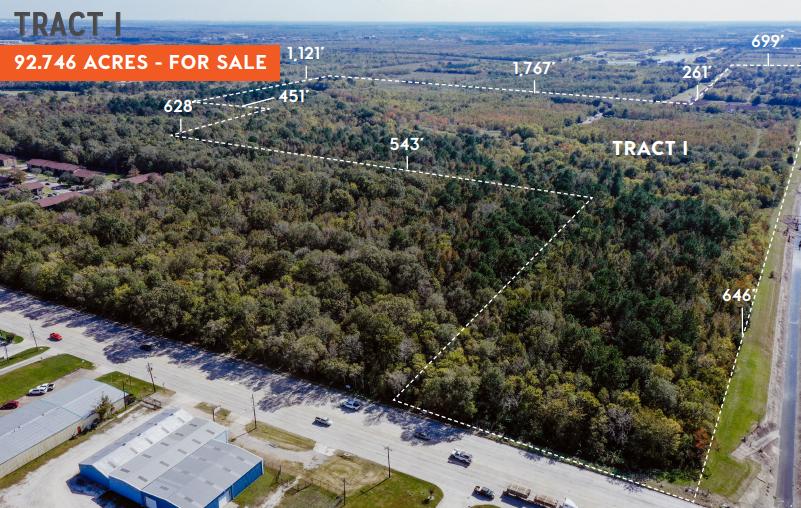
- • Great retail development tracts
- • Multiple tracts
- • Can be bought separately or in any combination
- • Individual tracts can also be divided
- • CollegeHighway 90 frontage
- • Future Dowlen frontage
Additional Photos


Listing Agents

Lee Wheeler
O: 409-899-3300
lwheeler@wheelercommercial.com
O: 409-899-3300
lwheeler@wheelercommercial.com
While we strive to provide the most accurate information, all listing information, and demographic data, is provided by third-parties. As such, MyEListing will not be responsible for the accuracy of the information. It is strongly recommended that you verify all information with the listing agent, and any relevant agencies, prior to making any decisions.


