Specialty Real Estate
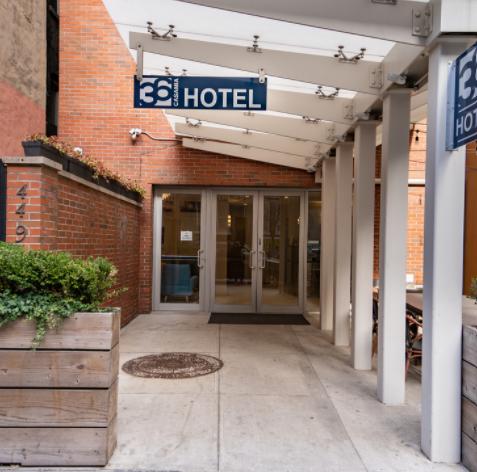
449 West 36th Street New York, NY 10018
449 West 36th Street New York, NY 10018
Details & Description
Property Highlights
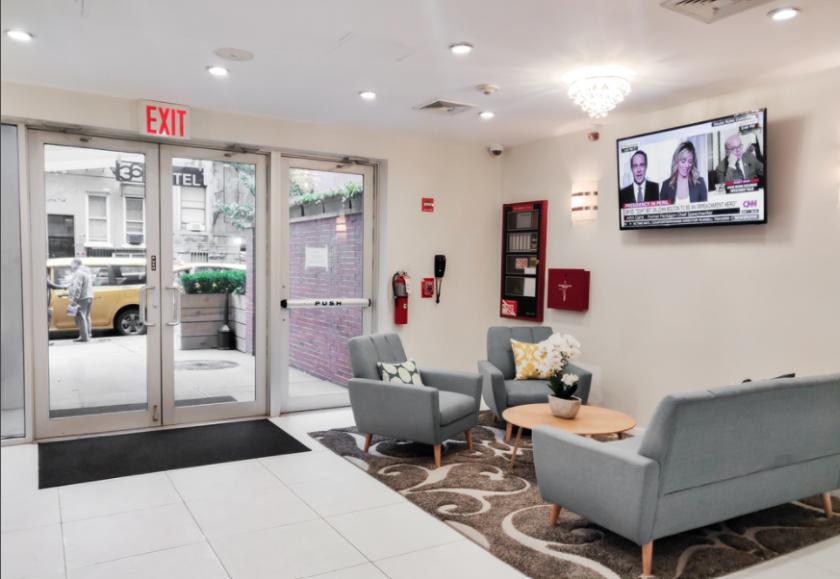
- • Open-Air Atrium on First-Floor with Seating
- • 15 Floors
- • 39 Units 250 Square Feet Per Unit
- • Building Size 12,340 SF
Listing Agents

Christopher Parrino
KW Commercial
O: 619-308-6860
cparrino@kwcommercial.com
KW Commercial
O: 619-308-6860
cparrino@kwcommercial.com

Toni Donnet
O: 619-469-0700
M: 619-549-8072
toni.donnet@gmail.com
O: 619-469-0700
M: 619-549-8072
toni.donnet@gmail.com
While we strive to provide the most accurate information, all listing information, and demographic data, is provided by third-parties. As such, MyEListing will not be responsible for the accuracy of the information. It is strongly recommended that you verify all information with the listing agent, and any relevant agencies, prior to making any decisions.