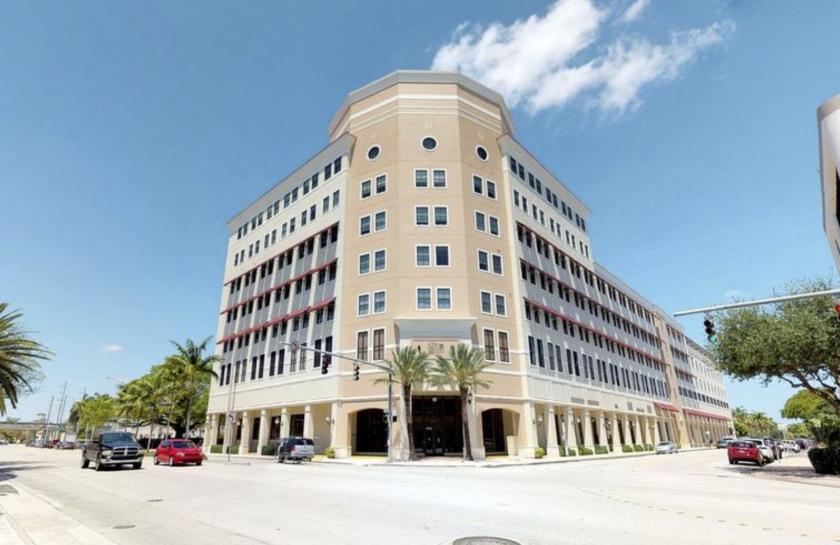
Office Space
6705 Red Road Coral Gables, FL 33143
6705 Red Road Coral Gables, FL 33143
Details & Description
Property Highlights
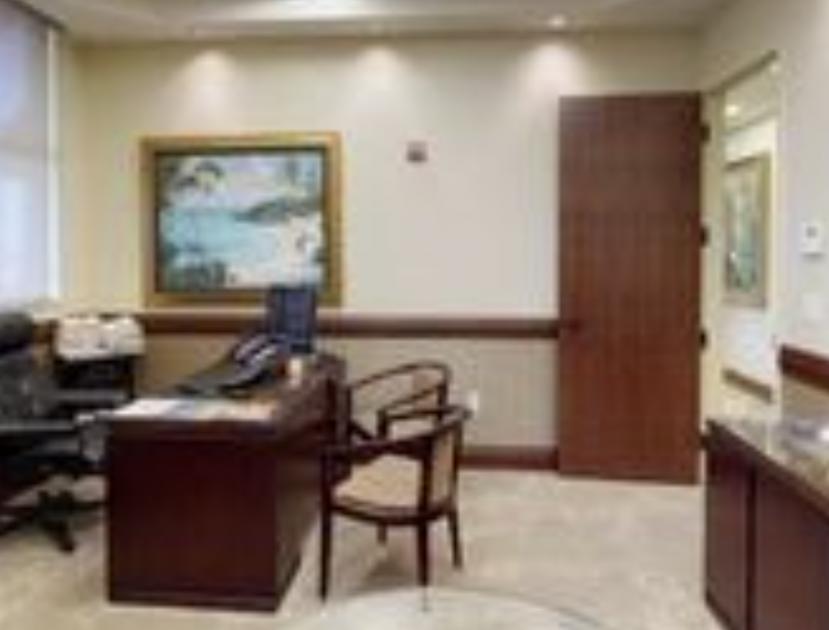
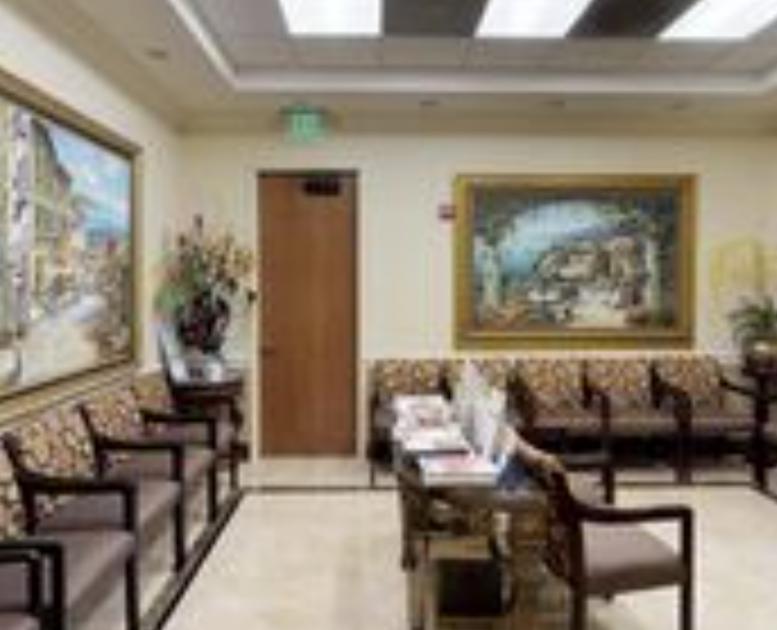
- • 2 MD offices
- • 4 closets with built in shelving
- • Eat in kitchen with full size fridge window
- • Full bathroom with shower
Listing Agents

Carlos Ros
KW Commercial
O: 305-215-5116
cros@kw.com
KW Commercial
O: 305-215-5116
cros@kw.com
While we strive to provide the most accurate information, all listing information, and demographic data, is provided by third-parties. As such, MyEListing will not be responsible for the accuracy of the information. It is strongly recommended that you verify all information with the listing agent, and any relevant agencies, prior to making any decisions.