Specialty Real Estate
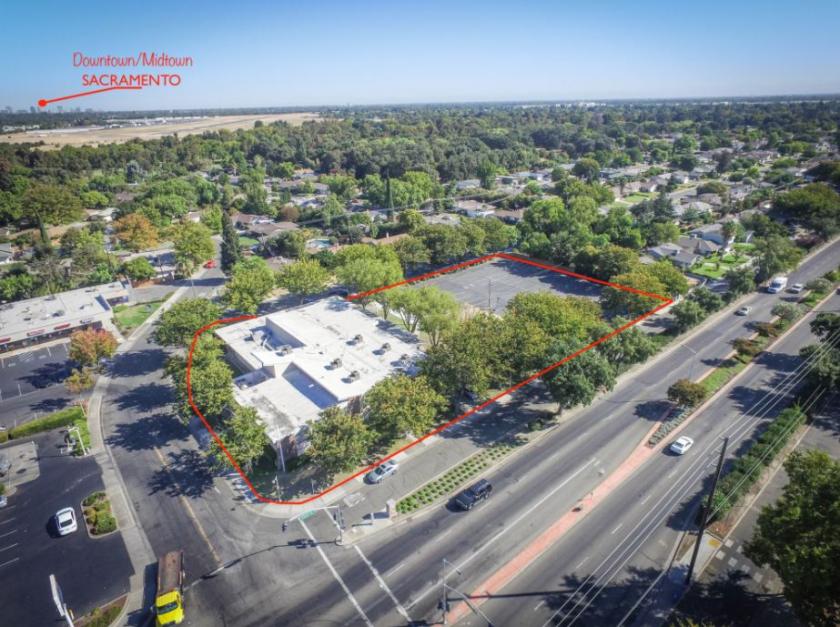
1401 Florin Road Sacramento, CA 95822
1401 Florin Road Sacramento, CA 95822
Details & Description
Property Highlights
- • Newly Installed HVAC
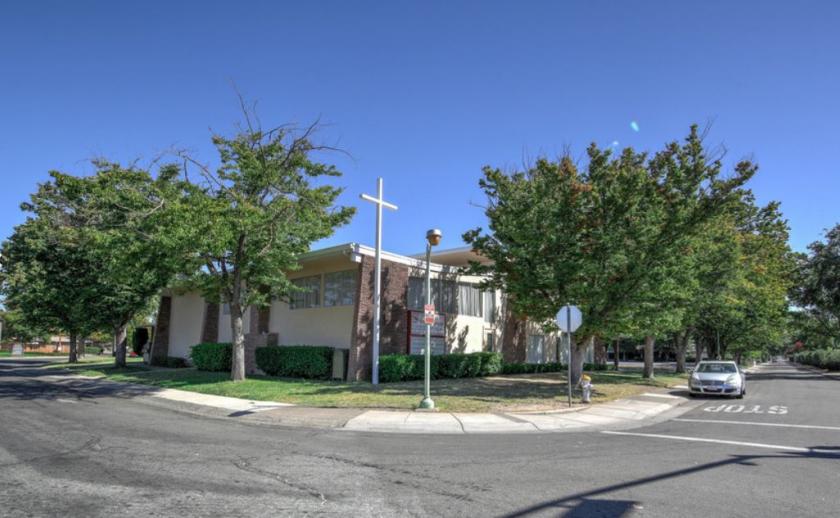
- • Seats Up to 400 People
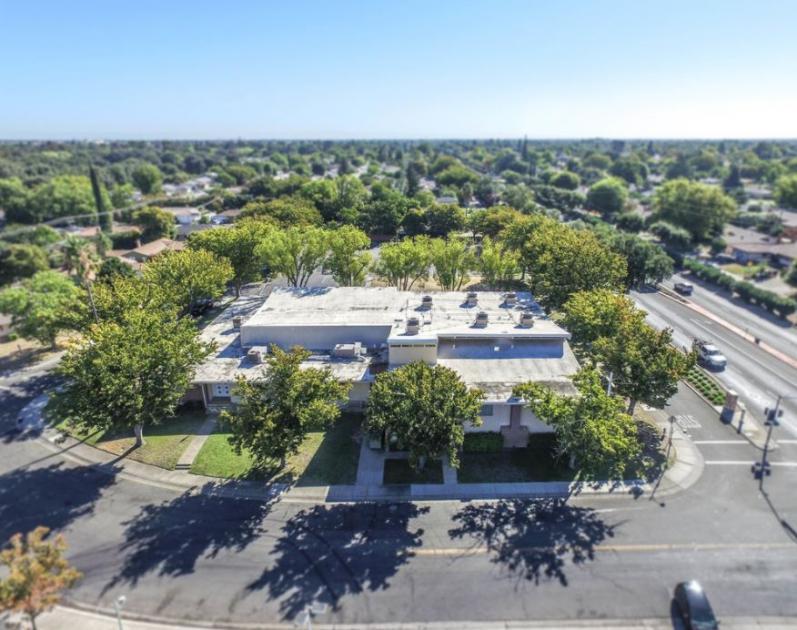
- • Parking Spaces 66 Surface Spaces are available
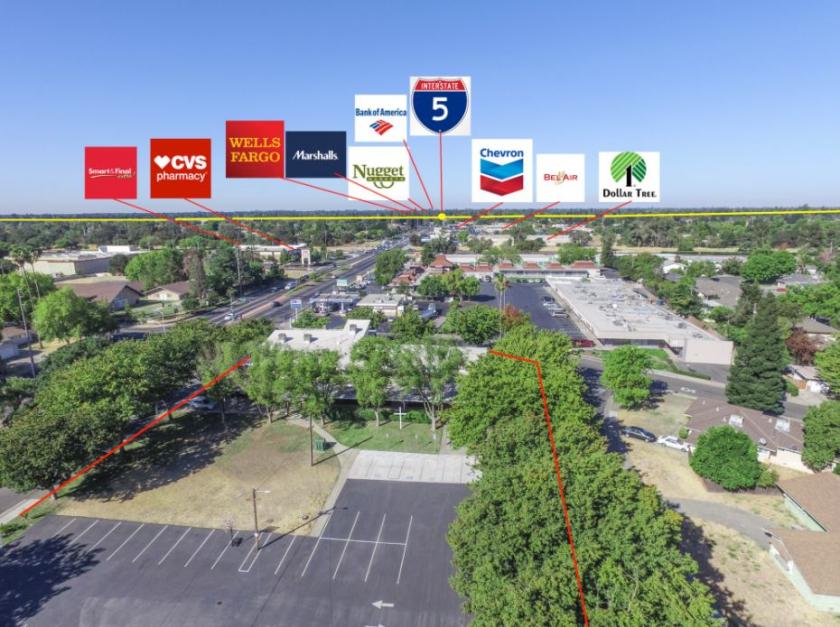
- • Easy Access to I-5 and Hwy-99
Additional Photos
Listing Agents

Tuan Nguyen
KW Commercial
O: 916-798-5798
tuan@kwcommercial.com
KW Commercial
O: 916-798-5798
tuan@kwcommercial.com
While we strive to provide the most accurate information, all listing information, and demographic data, is provided by third-parties. As such, MyEListing will not be responsible for the accuracy of the information. It is strongly recommended that you verify all information with the listing agent, and any relevant agencies, prior to making any decisions.


