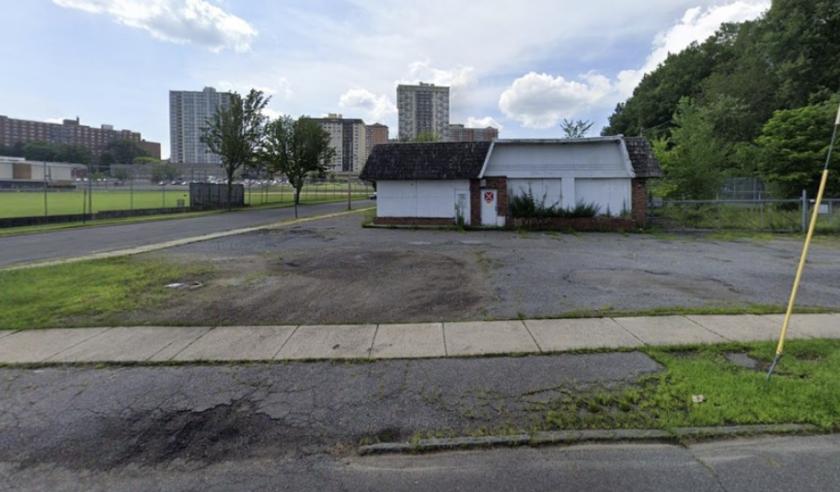
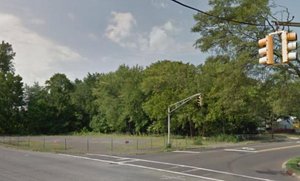
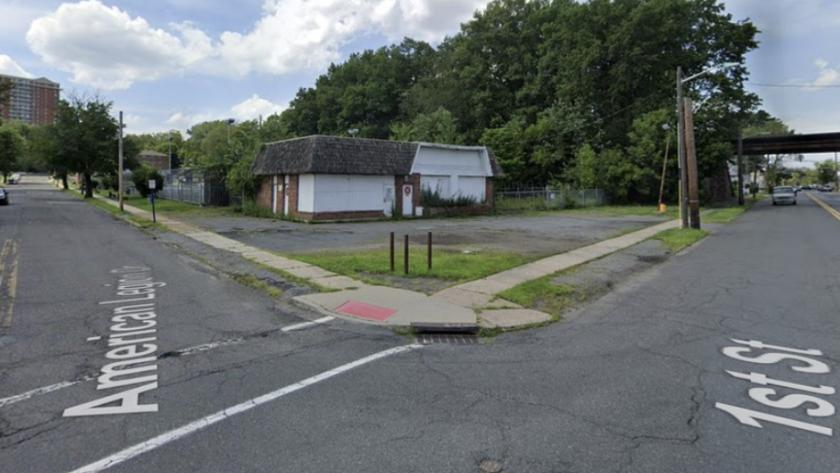
1-Mile | 3-Miles | 5-Miles | ||
---|---|---|---|---|
Total Population | 36,775 | 208,379 | 589,994 | |
Population Median Age | 40 | 40 | 39 | |
Population by Age | 0-9 Yrs | 4480 (12%) | 24051 (11%) | 70173 (11%) |
10-19 Yrs | 2757 (7%) | 23306 (11%) | 72356 (12%) | |
20-29 Yrs | 5815 (15%) | 27985 (13%) | 77487 (13%) | |
30-39 Yrs | 6007 (16%) | 31838 (15%) | 83658 (14%) | |
40-49 Yrs | 5045 (13%) | 26910 (12%) | 79164 (13%) | |
50-59 Yrs | 5049 (13%) | 28985 (13%) | 82495 (13%) | |
60-69 Yrs | 3704 (10%) | 23356 (11%) | 64281 (10%) | |
70+ Yrs | 3917 (10%) | 21948 (10%) | 60379 (10%) | |
Median HH Income | $68,786 | $82,670 | $79,115 | |
Total Household Income | < 24K | 2878 (18%) | 11458 (14%) | 33778 (16%) |
25-49K | 2649 (16%) | 12568 (16%) | 35485 (17%) | |
50-74K | 2899 (18%) | 11205 (14%) | 30810 (14%) | |
75-99K | 2284 (14%) | 10184 (13%) | 25886 (12%) | |
100-199K | 3832 (24%) | 22083 (28%) | 57917 (27%) | |
200K+ | 1116 (7%) | 9214 (12%) | 24795 (11%) | |
Highest Education Level | No Diploma | 3251 | 15679 | 48665 |
Diploma or GED | 7594 | 39088 | 113901 | |
Some College | 4002 | 24200 | 64686 | |
Assoc. Degree | 1712 | 9300 | 24603 | |
Bachelors Degree | 6778 | 37346 | 102045 | |
Higher Degree | 3779 | 21558 | 54599 | |
Total Housing Units | 16,712 | 81,042 | 221,114 | |
--Owner-Occupied | 5,300 | 40,566 | 110,119 | |
--Renter-Occupied | 10,358 | 36,147 | 98,553 | |
Owner-Occupied Values | < 100K | 163 | 927 | 2948 |
100-199K | 1086 | 2383 | 6473 | |
200-299K | 1319 | 6348 | 16962 | |
300-399K | 1577 | 13893 | 33220 | |
400-499K | 731 | 9123 | 23900 | |
500K+ | 424 | 7892 | 26616 | |
Total Working Age Population | 30,511 | 170,622 | 477,292 | |
In Work Force | 21,141 | 114,028 | 315,796 | |
Not In Work Force | 9,370 | 56,594 | 161,497 | |
Workforce Employed | 20,299 | 109,388 | 302,284 | |
Workforce Unemployed | 842 | 4,575 | 13,285 | |
Civlian Workforce | 21,141 | 113,963 | 315,569 | |
Military Workforce | 0 | 65 | 227 | |
Total Households | 15,658 | 76,713 | 208,672 | |
Family Households | 8,383 | 51,394 | 146,735 | |
Non-Family Households | 7,275 | 25,319 | 61,937 | |
Married Couple | 5,464 | 37,212 | 105,206 | |
Other Family | 2,918 | 14,182 | 41,529 | |
Married w/Child | 2,514 | 15,738 | 45,867 | |
Single Male w/Child | 293 | 1,134 | 3,726 | |
Single Female w/Child | 981 | 4,806 | 14,168 |
Population Change Last Two Decades - Plus Projection
2000 | % | 2010 | % | 2020 | % | 2030 | |
---|---|---|---|---|---|---|---|
New Jersey | 8,414,350 | +4 | 8,791,894 | +4 | 9,132,700 | +4 | 9,530,900 |
Bergen County | 884,118 | +2 | 905,116 | +7 | 967,500 | +7 | 1,031,500 |
Essex County | 793,633 | -1 | 783,969 | +3 | 808,300 | +3 | 829,800 |
Hudson County | 608,975 | +4 | 634,266 | +12 | 708,100 | +6 | 747,400 |
Passaic County | 489,049 | +2 | 501,226 | +4 | 521,700 | +3 | 536,100 |
New York | 18,976,457 | +2 | 19,378,102 | +4 | 20,146,131 | +2 | 20,604,030 |
New York County | 1,537,195 | +3 | 1,585,873 | +6 | 1,688,894 | +2 | 1,727,631 |
Westchester County | 923,459 | +3 | 949,113 | +5 | 996,039 | +4 | 1,037,234 |
Total Working Age Population:
Total Households:
Total Working Age Population:
Total Households:
Total Working Age Population:
Total Households: