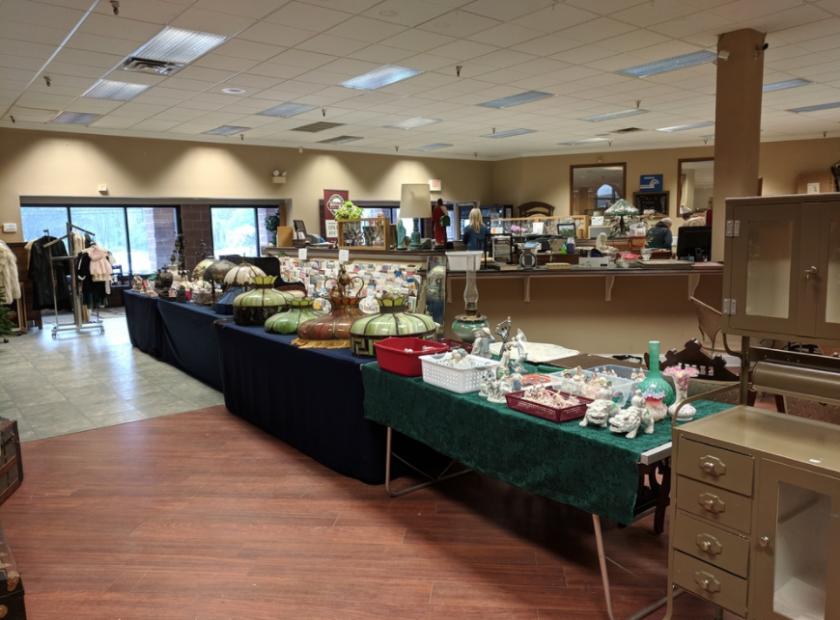
Retail Space
10609 Chillicothe Road Willoughby, OH 44094
10609 Chillicothe Road Willoughby, OH 44094
Details & Description
Property Highlights
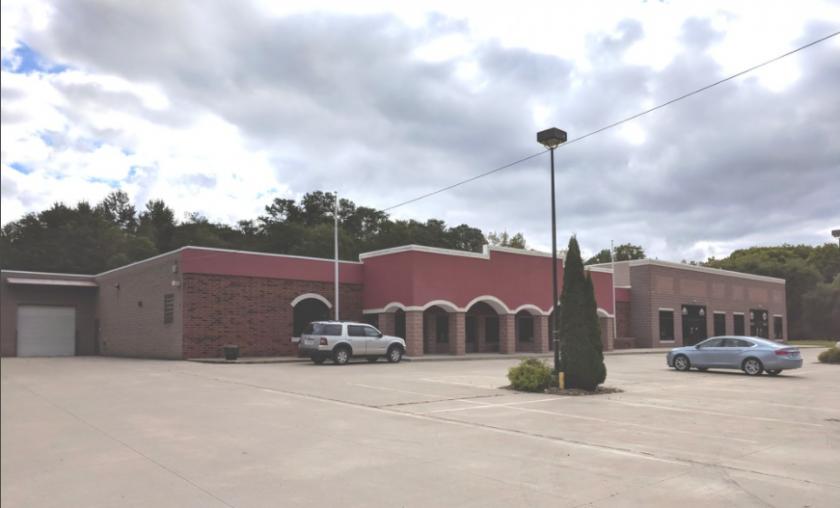
- • Well-Maintained Masonry Building
- • Large Parking Lot with Expansion Capabilities
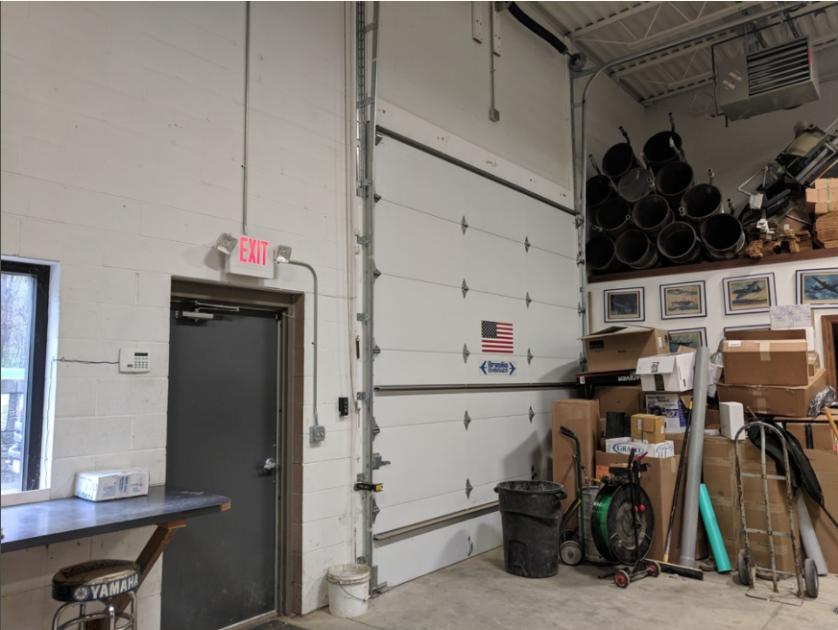
- • Owner Occupied with Multiple Entry Points
- • Close Proximity to Cleveland Metropolitan Market
- • Grade Level and Recessed Loading Docks
Listing Agents

Rick Osborne Jr.
O: 440-299-5190
M: 216-219-0290
rick.osbornejr@kw.com
O: 440-299-5190
M: 216-219-0290
rick.osbornejr@kw.com
While we strive to provide the most accurate information, all listing information, and demographic data, is provided by third-parties. As such, MyEListing will not be responsible for the accuracy of the information. It is strongly recommended that you verify all information with the listing agent, and any relevant agencies, prior to making any decisions.