Industrial Properties
8820 East Avenue Mentor, OH 44060
8820 East Avenue Mentor, OH 44060
Details & Description
Property Highlights
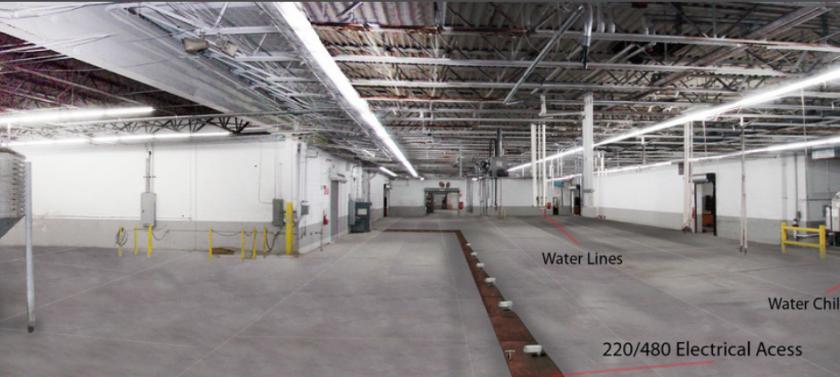
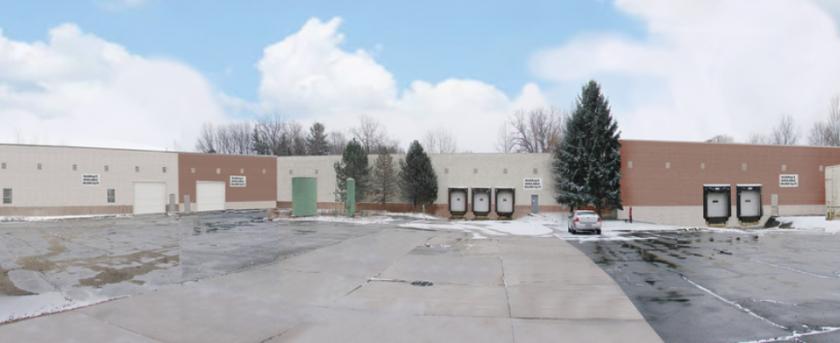
- • New InteriorExterior improvements underway
- • 8-Units Available for 22,000 SF to 10,000 SF
- • Central location for access to SR 2 and I-90
Listing Agents

Rick Osborne Jr.
O: 440-299-5190
M: 216-219-0290
rick.osbornejr@kw.com
O: 440-299-5190
M: 216-219-0290
rick.osbornejr@kw.com
While we strive to provide the most accurate information, all listing information, and demographic data, is provided by third-parties. As such, MyEListing will not be responsible for the accuracy of the information. It is strongly recommended that you verify all information with the listing agent, and any relevant agencies, prior to making any decisions.