Commercial Land
5600 North Ridge Road Madison, OH 44057
5600 North Ridge Road Madison, OH 44057
Details & Description
Property Highlights
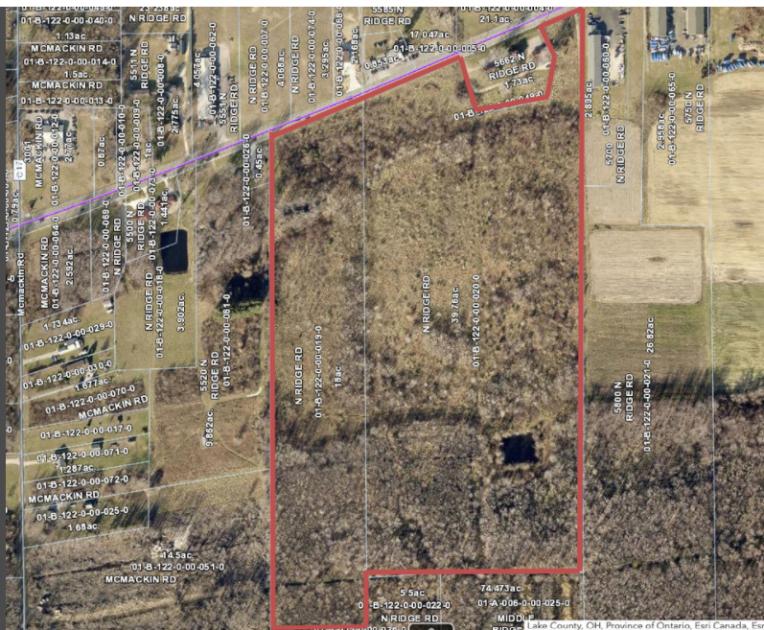
- • Commercial Land for Frontage on North Ridge Road.
- • Easy Access to SR 20 and Surrounding Areas
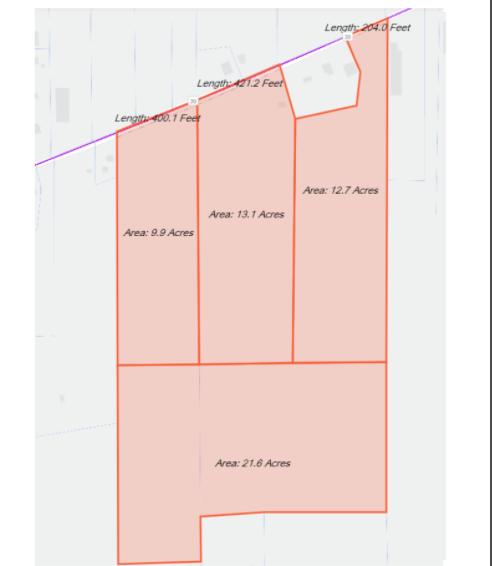
- • Will Sub-divide
- • Ideal for Nursery andor Landscape Business
Listing Agents

Rick Osborne Jr.
O: 440-299-5190
M: 216-219-0290
rick.osbornejr@kw.com
O: 440-299-5190
M: 216-219-0290
rick.osbornejr@kw.com
While we strive to provide the most accurate information, all listing information, and demographic data, is provided by third-parties. As such, MyEListing will not be responsible for the accuracy of the information. It is strongly recommended that you verify all information with the listing agent, and any relevant agencies, prior to making any decisions.