Retail Space
207 East 34th Street Boise, ID 83714
207 East 34th Street Boise, ID 83714
Details & Description
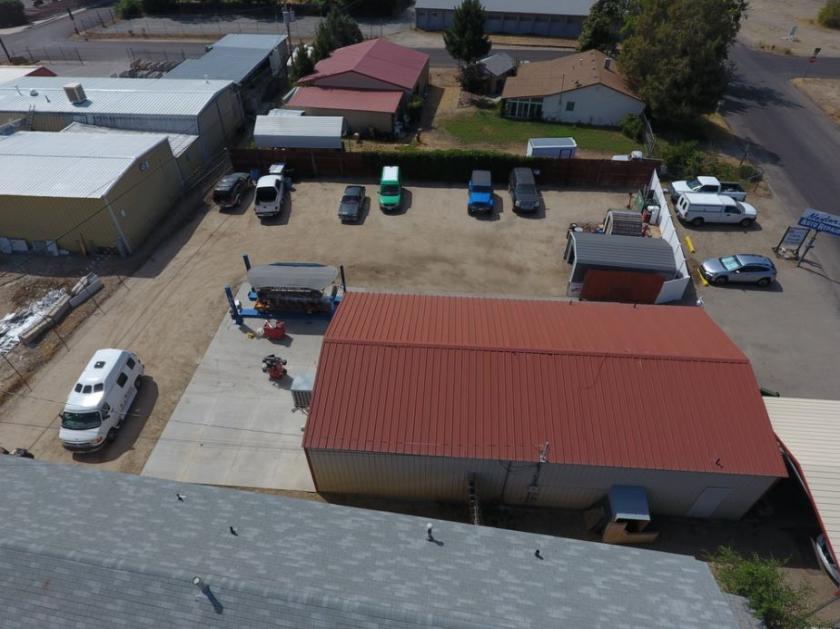
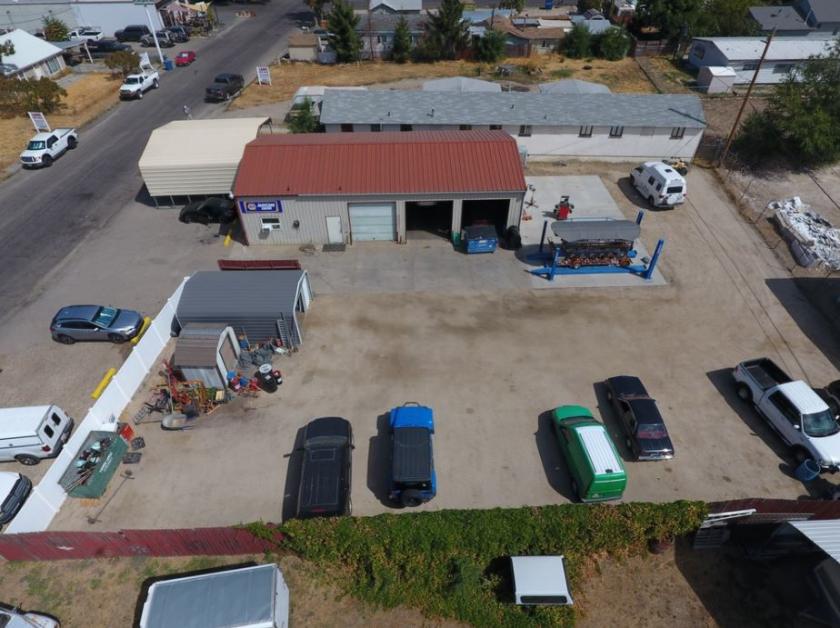
Property Highlights
- • 3 grade level 10 overhead doors
- • 4 service bays
- • Gas heat with AC
- • Secured fenced in yard
Listing Agents

Chris Novak
KW Commercial
O: 208-869-4713
cnovak14@yahoo.com
KW Commercial
O: 208-869-4713
cnovak14@yahoo.com
While we strive to provide the most accurate information, all listing information, and demographic data, is provided by third-parties. As such, MyEListing will not be responsible for the accuracy of the information. It is strongly recommended that you verify all information with the listing agent, and any relevant agencies, prior to making any decisions.