Commercial Land
402 Blackbrook Road Painesville, OH 44077
402 Blackbrook Road Painesville, OH 44077
Details & Description
Property Highlights
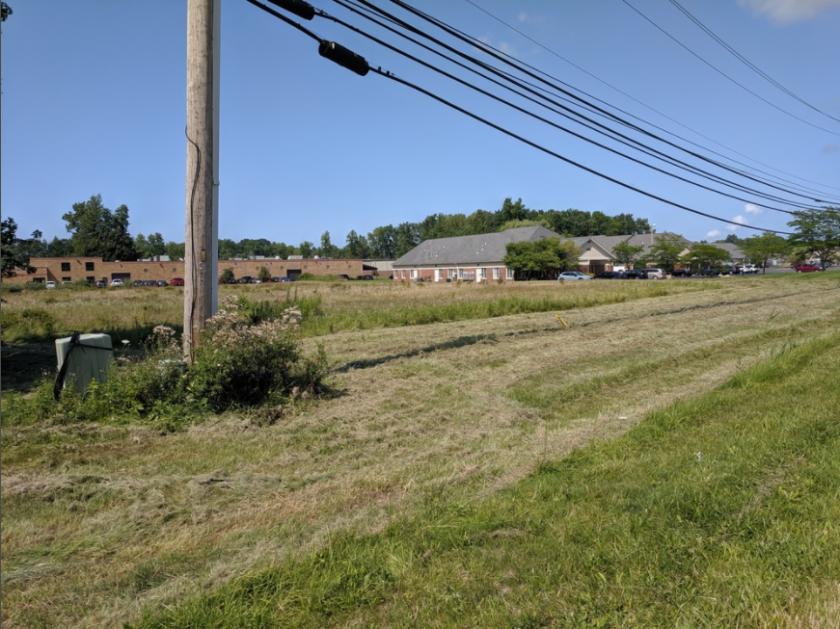
- • Zoned Light Industrial
- • Flat, level, sandy soil
- • No Income Tax
- • All utilities present
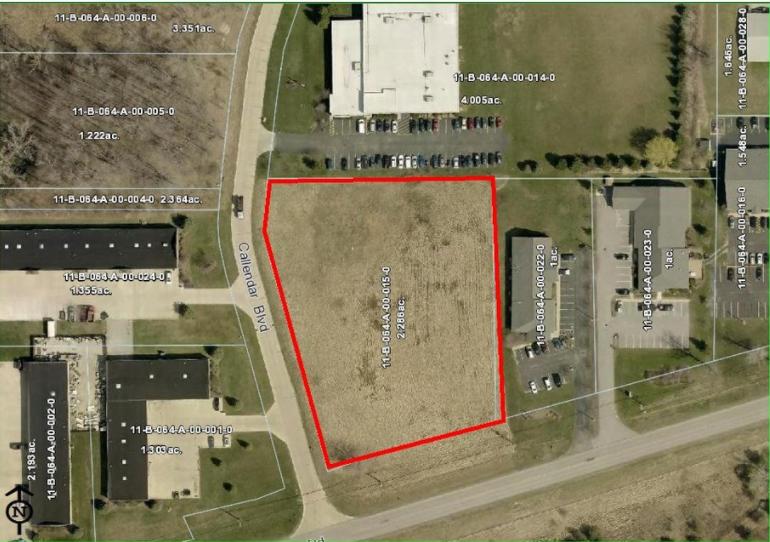
- • Can be Subdivided
- • Shovel Ready Site
Listing Agents

Rick Osborne Jr.
O: 440-299-5190
M: 216-219-0290
rick.osbornejr@kw.com
O: 440-299-5190
M: 216-219-0290
rick.osbornejr@kw.com
While we strive to provide the most accurate information, all listing information, and demographic data, is provided by third-parties. As such, MyEListing will not be responsible for the accuracy of the information. It is strongly recommended that you verify all information with the listing agent, and any relevant agencies, prior to making any decisions.