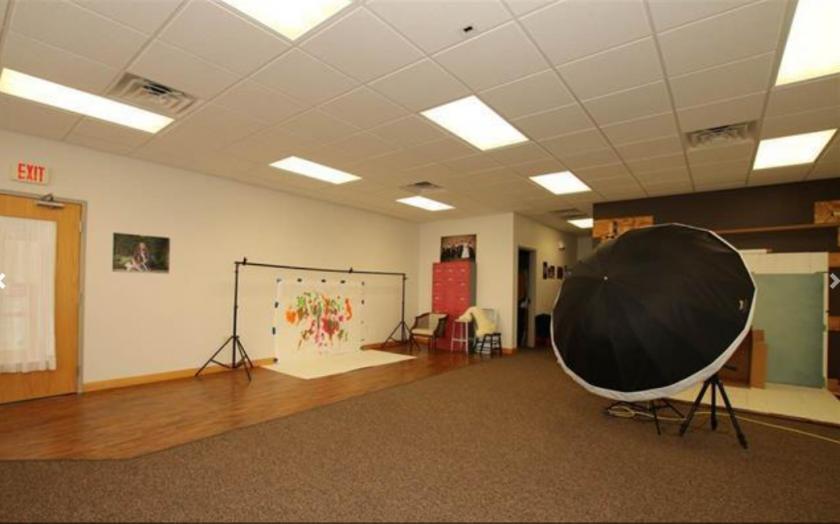
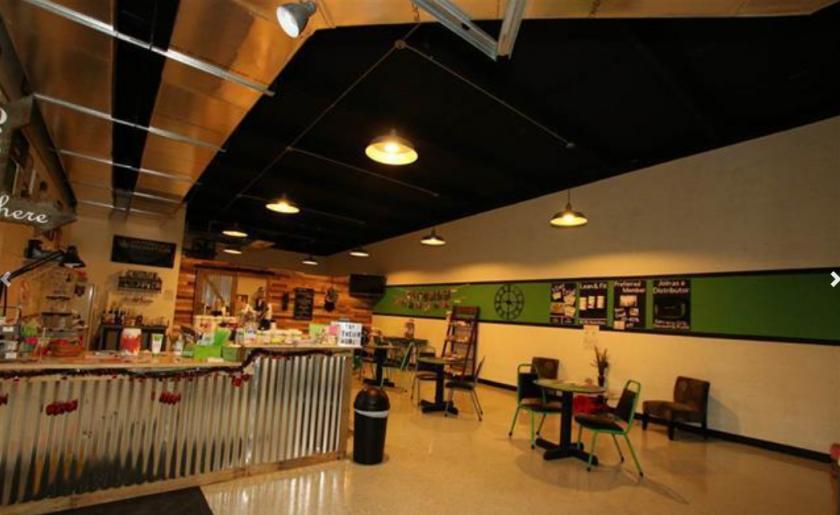
Retail Space
South Side Shopping Center - 104 S Side Shopping Chilton, WI 53014
South Side Shopping Center - 104 S Side Shopping Chilton, WI 53014
Details & Description
Property Highlights
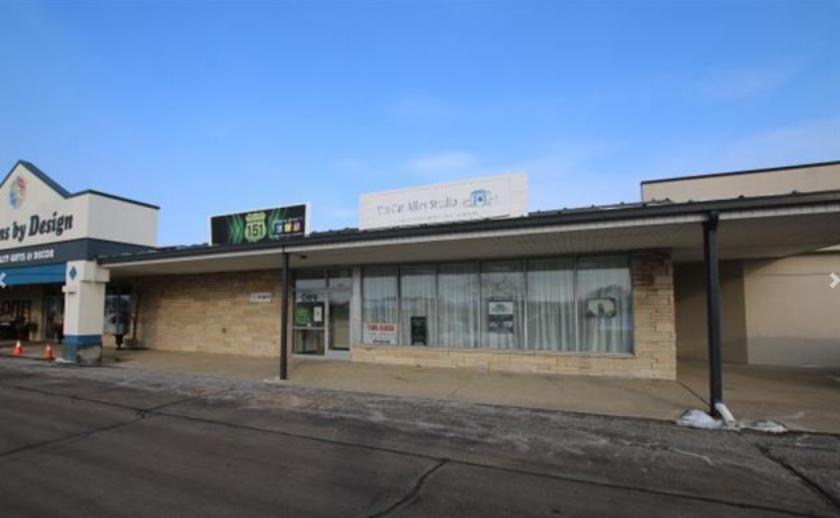
- • Corner Lot - Great Visibility
- • Three Units
- • Large Parking Lot
- • Over 5,000 SF
- • Large Traffic Counts
Listing Agents

Chris Mokler
O: 920-279-6104
chrismokler@kwcommercial.com
O: 920-279-6104
chrismokler@kwcommercial.com
While we strive to provide the most accurate information, all listing information, and demographic data, is provided by third-parties. As such, MyEListing will not be responsible for the accuracy of the information. It is strongly recommended that you verify all information with the listing agent, and any relevant agencies, prior to making any decisions.