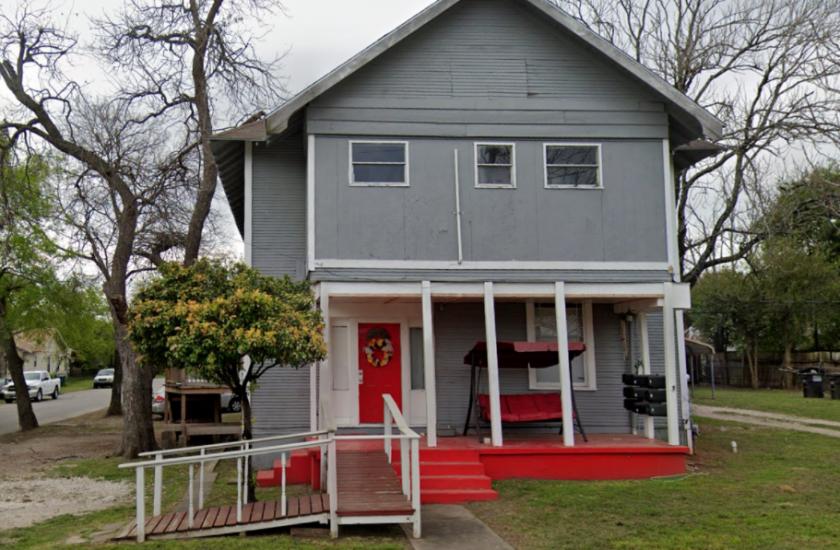
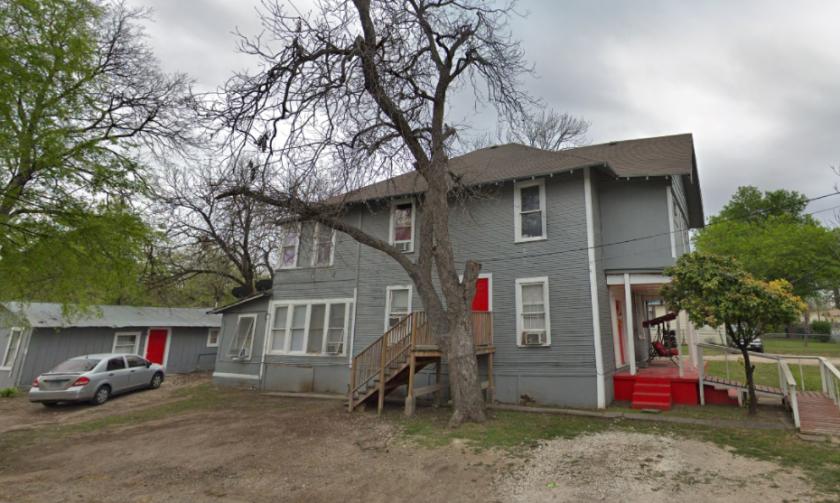
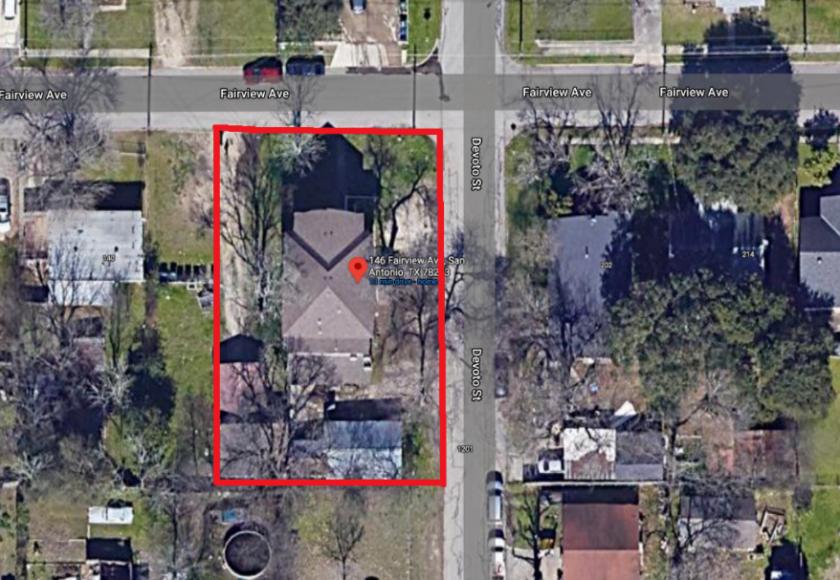
1-Mile | 3-Miles | 5-Miles | ||
---|---|---|---|---|
Total Population | 16,550 | 136,573 | 321,517 | |
Population Median Age | 36 | 36 | 36 | |
Population by Age | 0-9 Yrs | 2376 (14%) | 19905 (14%) | 46939 (14%) |
10-19 Yrs | 2214 (13%) | 18616 (13%) | 45480 (14%) | |
20-29 Yrs | 2466 (14%) | 19574 (14%) | 47126 (14%) | |
30-39 Yrs | 2140 (12%) | 19652 (14%) | 46137 (14%) | |
40-49 Yrs | 2183 (13%) | 17087 (12%) | 39778 (12%) | |
50-59 Yrs | 2087 (12%) | 17096 (12%) | 38876 (12%) | |
60-69 Yrs | 1857 (11%) | 13328 (9%) | 30117 (9%) | |
70+ Yrs | 1226 (7%) | 11316 (8%) | 27064 (8%) | |
Median HH Income | $31,835 | $35,961 | $36,207 | |
Total Household Income | < 24K | 2285 (42%) | 15419 (35%) | 36023 (35%) |
25-49K | 1382 (25%) | 12811 (29%) | 27696 (27%) | |
50-74K | 816 (15%) | 7781 (17%) | 17412 (17%) | |
75-99K | 414 (7%) | 3833 (8%) | 9358 (9%) | |
100-199K | 440 (8%) | 3443 (7%) | 8855 (8%) | |
200K+ | 20 (0%) | 635 (1%) | 1424 (1%) | |
Highest Education Level | No Diploma | 3447 | 25869 | 61509 |
Diploma or GED | 3651 | 31016 | 69202 | |
Some College | 2445 | 18215 | 41833 | |
Assoc. Degree | 506 | 4411 | 10861 | |
Bachelors Degree | 518 | 6089 | 15795 | |
Higher Degree | 204 | 3179 | 7639 | |
Total Housing Units | 5,839 | 49,320 | 112,850 | |
--Owner-Occupied | 2,692 | 23,486 | 52,615 | |
--Renter-Occupied | 2,665 | 20,435 | 48,153 | |
Owner-Occupied Values | < 100K | 1885 | 15848 | 35357 |
100-199K | 714 | 5669 | 12843 | |
200-299K | 74 | 895 | 2285 | |
300-399K | 20 | 398 | 869 | |
400-499K | 0 | 208 | 412 | |
500K+ | 0 | 467 | 849 | |
Total Working Age Population | 12,713 | 104,850 | 246,250 | |
In Work Force | 7,476 | 61,508 | 142,762 | |
Not In Work Force | 5,237 | 43,342 | 103,488 | |
Workforce Employed | 7,131 | 57,680 | 132,789 | |
Workforce Unemployed | 345 | 3,677 | 9,220 | |
Civlian Workforce | 7,476 | 61,357 | 142,009 | |
Military Workforce | 0 | 151 | 752 | |
Total Households | 5,357 | 43,922 | 100,769 | |
Family Households | 3,436 | 27,476 | 63,771 | |
Non-Family Households | 1,922 | 16,446 | 36,998 | |
Married Couple | 1,813 | 15,068 | 34,922 | |
Other Family | 1,623 | 12,407 | 28,849 | |
Married w/Child | 687 | 5,785 | 13,558 | |
Single Male w/Child | 187 | 1,384 | 2,735 | |
Single Female w/Child | 567 | 4,362 | 10,717 |
Population Change Last Two Decades - Plus Projection
2000 | % | 2010 | % | 2020 | % | 2030 | |
---|---|---|---|---|---|---|---|
Texas | 20,851,820 | +21 | 25,145,561 | +18 | 29,677,668 | +18 | 34,894,452 |
Bexar County | 1,392,931 | +23 | 1,714,773 | +22 | 2,093,502 | +20 | 2,502,617 |
Wilson County | 32,408 | +32 | 42,918 | +21 | 51,802 | +20 | 62,283 |
Total Working Age Population:
Total Households:
Total Working Age Population:
Total Households:
Total Working Age Population:
Total Households: