Industrial Properties
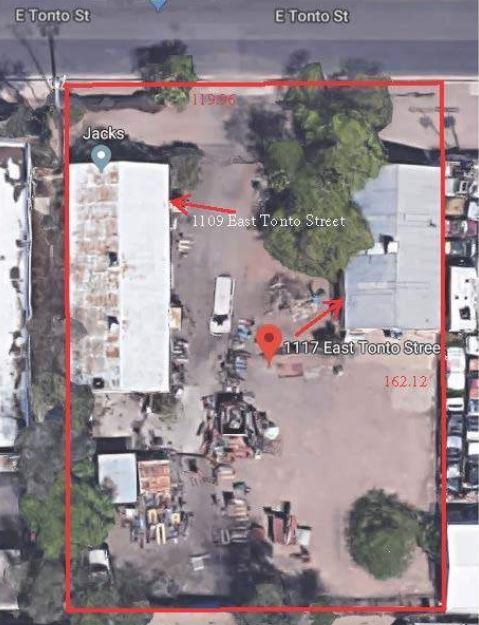
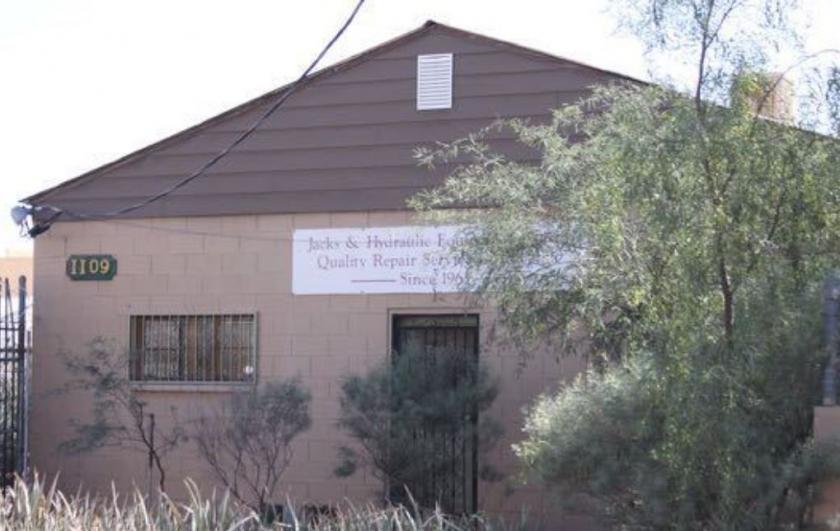
1109 East Tonto Street Phoenix, AZ 85034
1109 East Tonto Street Phoenix, AZ 85034
Details & Description
Property Highlights
- • Motivated Sellers
- • Great Downtown Location
- • Serving Arizona Since 1963
- • Use Is Flexible
- • 2 New AC units and 100 re-wired
- • 100 Fenced Yard
Listing Agents

Bill Nanney
KW Commercial
O: 480-759-4300
M: 480-686-1440
wjnanney@cox.net
KW Commercial
O: 480-759-4300
M: 480-686-1440
wjnanney@cox.net
While we strive to provide the most accurate information, all listing information, and demographic data, is provided by third-parties. As such, MyEListing will not be responsible for the accuracy of the information. It is strongly recommended that you verify all information with the listing agent, and any relevant agencies, prior to making any decisions.