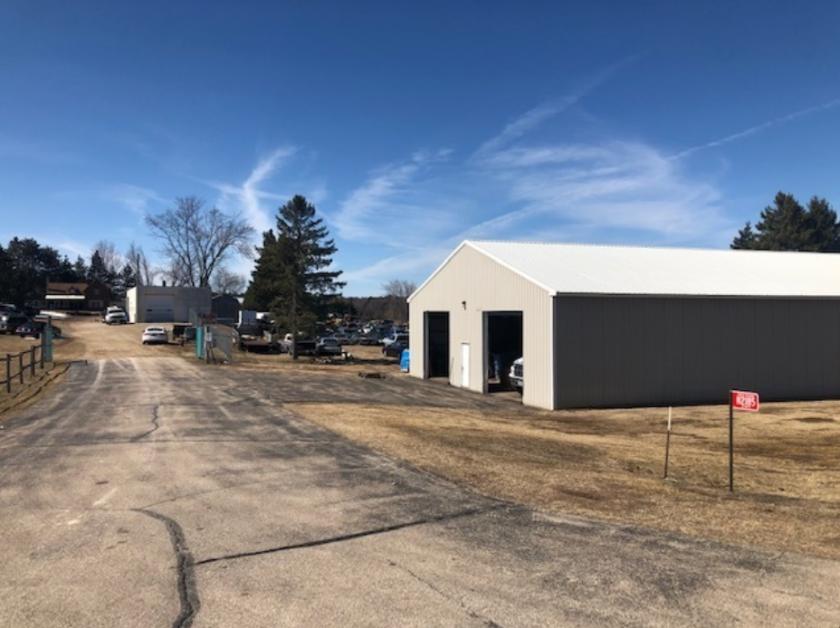
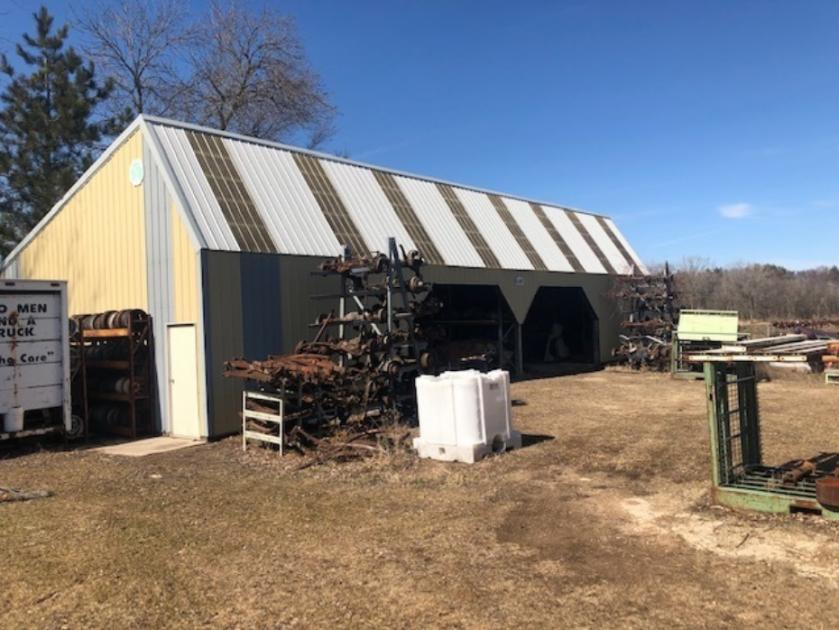
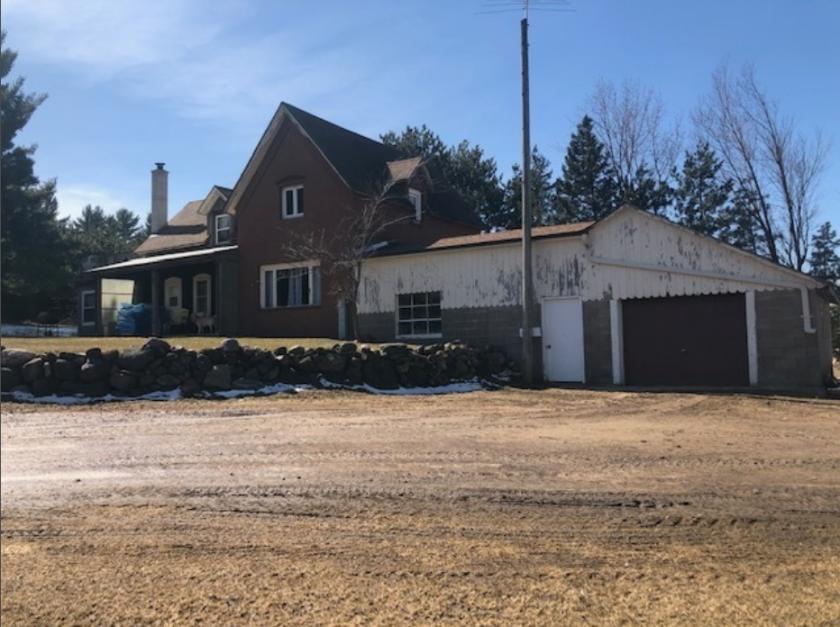
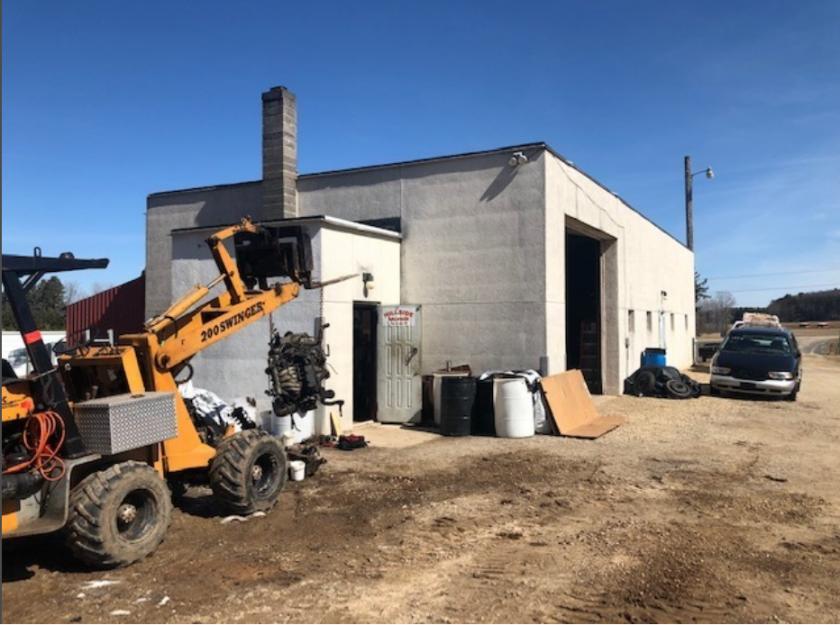
1-Mile | 3-Miles | 5-Miles | ||
---|---|---|---|---|
Total Population | 200 | 2,053 | 9,471 | |
Population Median Age | 44 | 42 | 40 | |
Population by Age | 0-9 Yrs | 15 (7%) | 213 (10%) | 1161 (12%) |
10-19 Yrs | 24 (12%) | 240 (11%) | 1160 (12%) | |
20-29 Yrs | 14 (7%) | 181 (8%) | 1177 (12%) | |
30-39 Yrs | 24 (12%) | 241 (11%) | 1160 (12%) | |
40-49 Yrs | 21 (10%) | 255 (12%) | 1253 (13%) | |
50-59 Yrs | 50 (25%) | 424 (20%) | 1495 (15%) | |
60-69 Yrs | 33 (16%) | 318 (15%) | 1140 (12%) | |
70+ Yrs | 19 (9%) | 180 (8%) | 923 (9%) | |
Median HH Income | $81,739 | $76,457 | $66,980 | |
Total Household Income | < 24K | 7 (8%) | 72 (8%) | 432 (11%) |
25-49K | 13 (15%) | 174 (20%) | 988 (25%) | |
50-74K | 17 (20%) | 169 (19%) | 729 (18%) | |
75-99K | 17 (20%) | 150 (17%) | 616 (15%) | |
100-199K | 25 (30%) | 240 (28%) | 980 (25%) | |
200K+ | 5 (6%) | 43 (5%) | 151 (3%) | |
Highest Education Level | No Diploma | 7 | 70 | 356 |
Diploma or GED | 57 | 568 | 2622 | |
Some College | 28 | 284 | 1231 | |
Assoc. Degree | 26 | 224 | 882 | |
Bachelors Degree | 24 | 251 | 1057 | |
Higher Degree | 9 | 99 | 354 | |
Total Housing Units | 96 | 954 | 4,279 | |
--Owner-Occupied | 78 | 732 | 2,909 | |
--Renter-Occupied | 5 | 116 | 987 | |
Owner-Occupied Values | < 100K | 10 | 90 | 421 |
100-199K | 24 | 233 | 1155 | |
200-299K | 26 | 244 | 843 | |
300-399K | 11 | 102 | 309 | |
400-499K | 6 | 48 | 122 | |
500K+ | 2 | 16 | 58 | |
Total Working Age Population | 172 | 1,704 | 7,642 | |
In Work Force | 117 | 1,177 | 5,375 | |
Not In Work Force | 55 | 527 | 2,267 | |
Workforce Employed | 114 | 1,148 | 5,245 | |
Workforce Unemployed | 2 | 28 | 130 | |
Civlian Workforce | 117 | 1,177 | 5,375 | |
Military Workforce | 0 | 0 | 0 | |
Total Households | 83 | 848 | 3,895 | |
Family Households | 63 | 630 | 2,615 | |
Non-Family Households | 20 | 218 | 1,280 | |
Married Couple | 56 | 544 | 2,181 | |
Other Family | 7 | 86 | 435 | |
Married w/Child | 15 | 162 | 784 | |
Single Male w/Child | 1 | 18 | 138 | |
Single Female w/Child | 1 | 25 | 128 |
Population Change Last Two Decades - Plus Projection
2000 | % | 2010 | % | 2020 | % | 2030 | |
---|---|---|---|---|---|---|---|
Wisconsin | 5,363,675 | +6 | 5,686,986 | +6 | 6,005,080 | +6 | 6,375,910 |
Outagamie County | 160,971 | +10 | 176,695 | +8 | 191,635 | +9 | 208,730 |
Waupaca County | 51,731 | +1 | 52,410 | +4 | 54,475 | +5 | 57,460 |
Total Working Age Population:
Total Households:
Total Working Age Population:
Total Households:
Total Working Age Population:
Total Households: