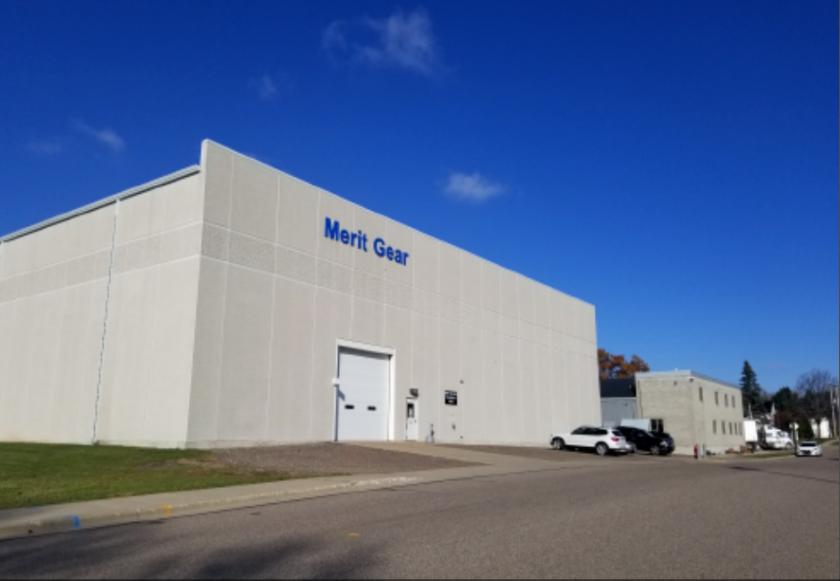
Flex-Office-Warehouse
810 Hudson Street Antigo, WI 54409
810 Hudson Street Antigo, WI 54409
Details & Description
Property Highlights
- • Many additions and updates
- • Easy HWY access
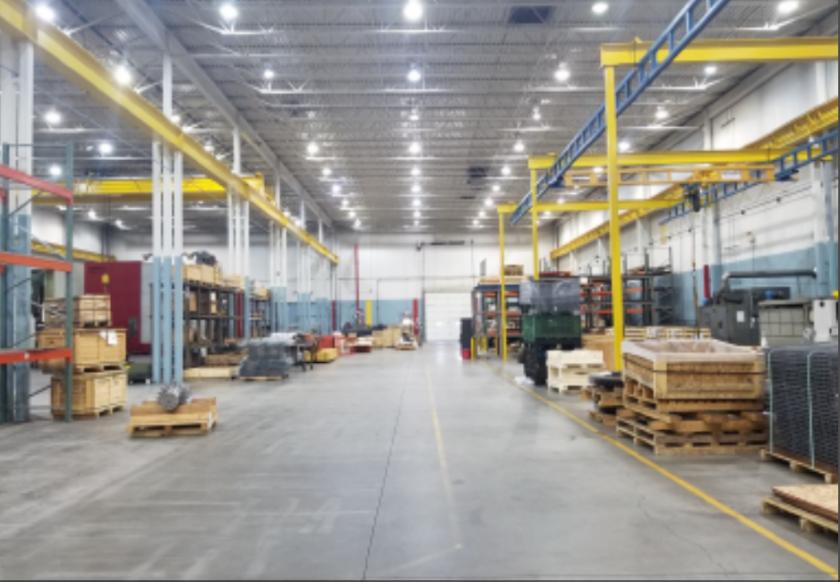
- • Very spacious
- • Class B Building
- • 4,644 SF Office Space
Listing Agents

Chris Mokler
O: 920-279-6104
chrismokler@kwcommercial.com
O: 920-279-6104
chrismokler@kwcommercial.com
While we strive to provide the most accurate information, all listing information, and demographic data, is provided by third-parties. As such, MyEListing will not be responsible for the accuracy of the information. It is strongly recommended that you verify all information with the listing agent, and any relevant agencies, prior to making any decisions.